Build dashboards
Create a Maple dashboard from scratch or a template, add charts, stats, tables and funnels over traces, logs, metrics and product events, add variables, and share it.
A dashboard is a grid of widgets that query your telemetry over one time range. Each widget is a chart, a single number, a table, a list, a funnel or a note, built with the query builder or with SQL. Dashboards live on the Dashboards page.
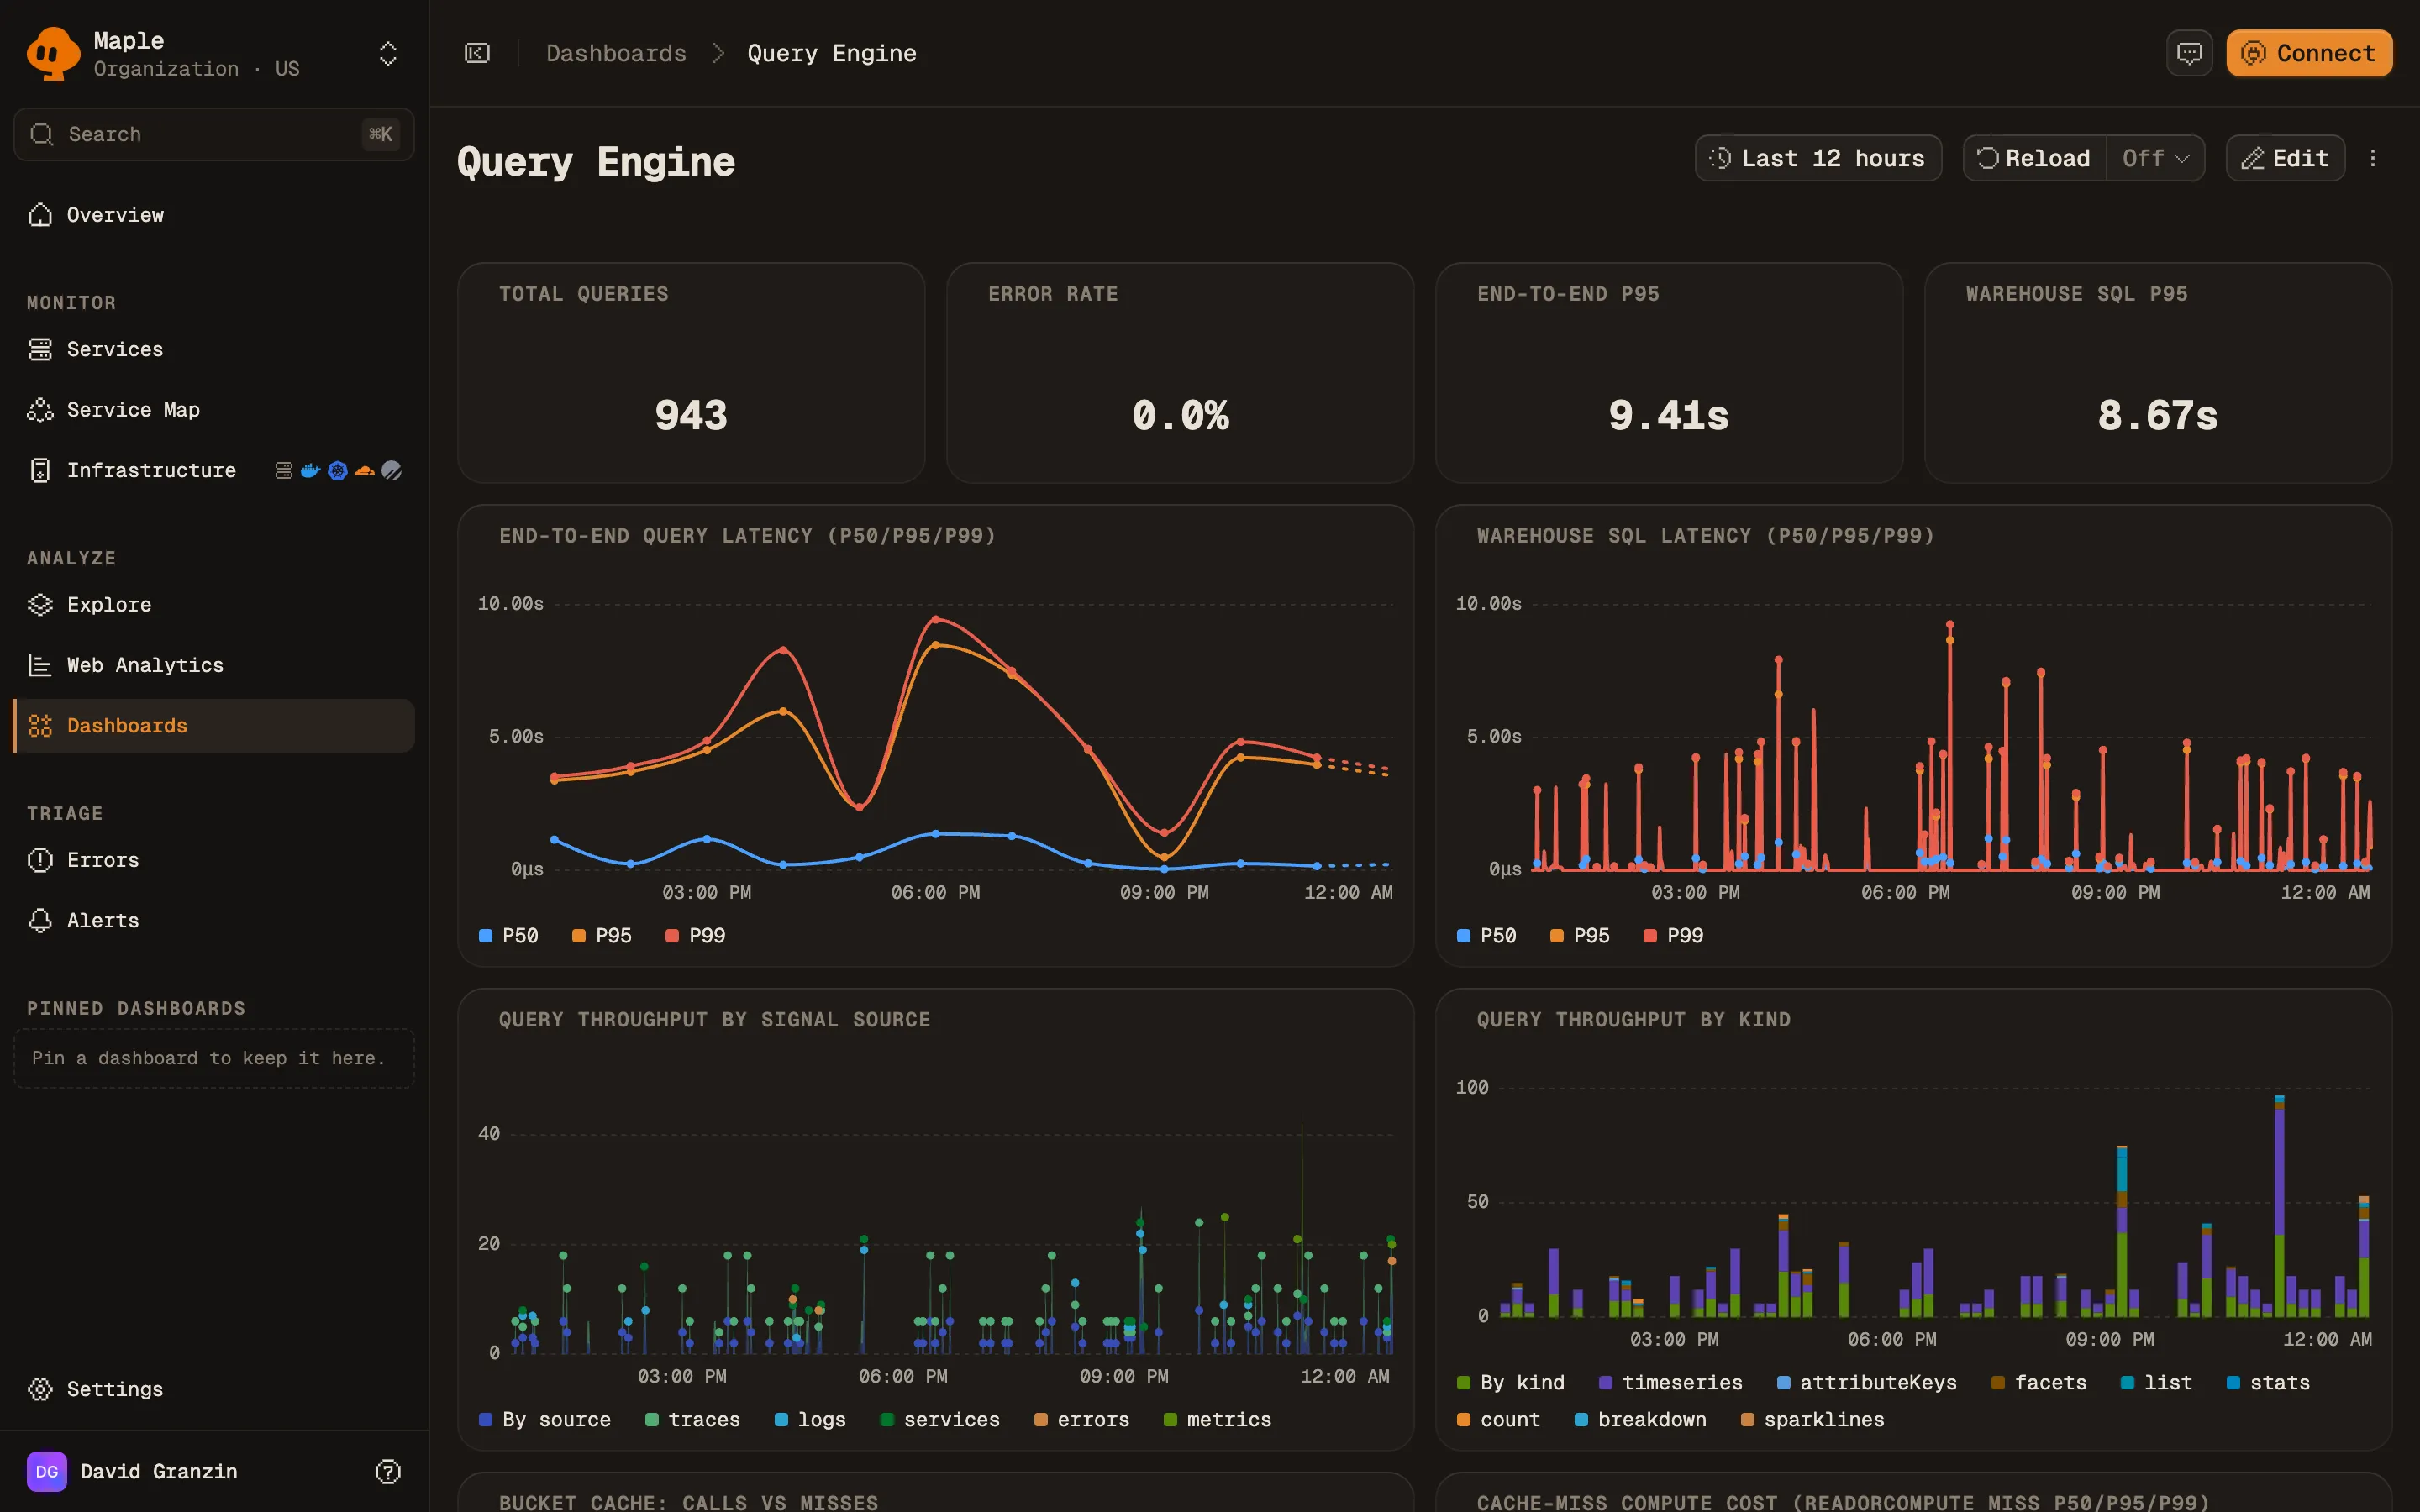
Create a dashboard
On Dashboards, pick one of three starting points:
- Create Dashboard opens an empty dashboard named “Untitled Dashboard”. Click the name to rename it.
- Browse templates opens Start from a template. See Templates.
- Import loads a dashboard from a JSON file exported from Maple.
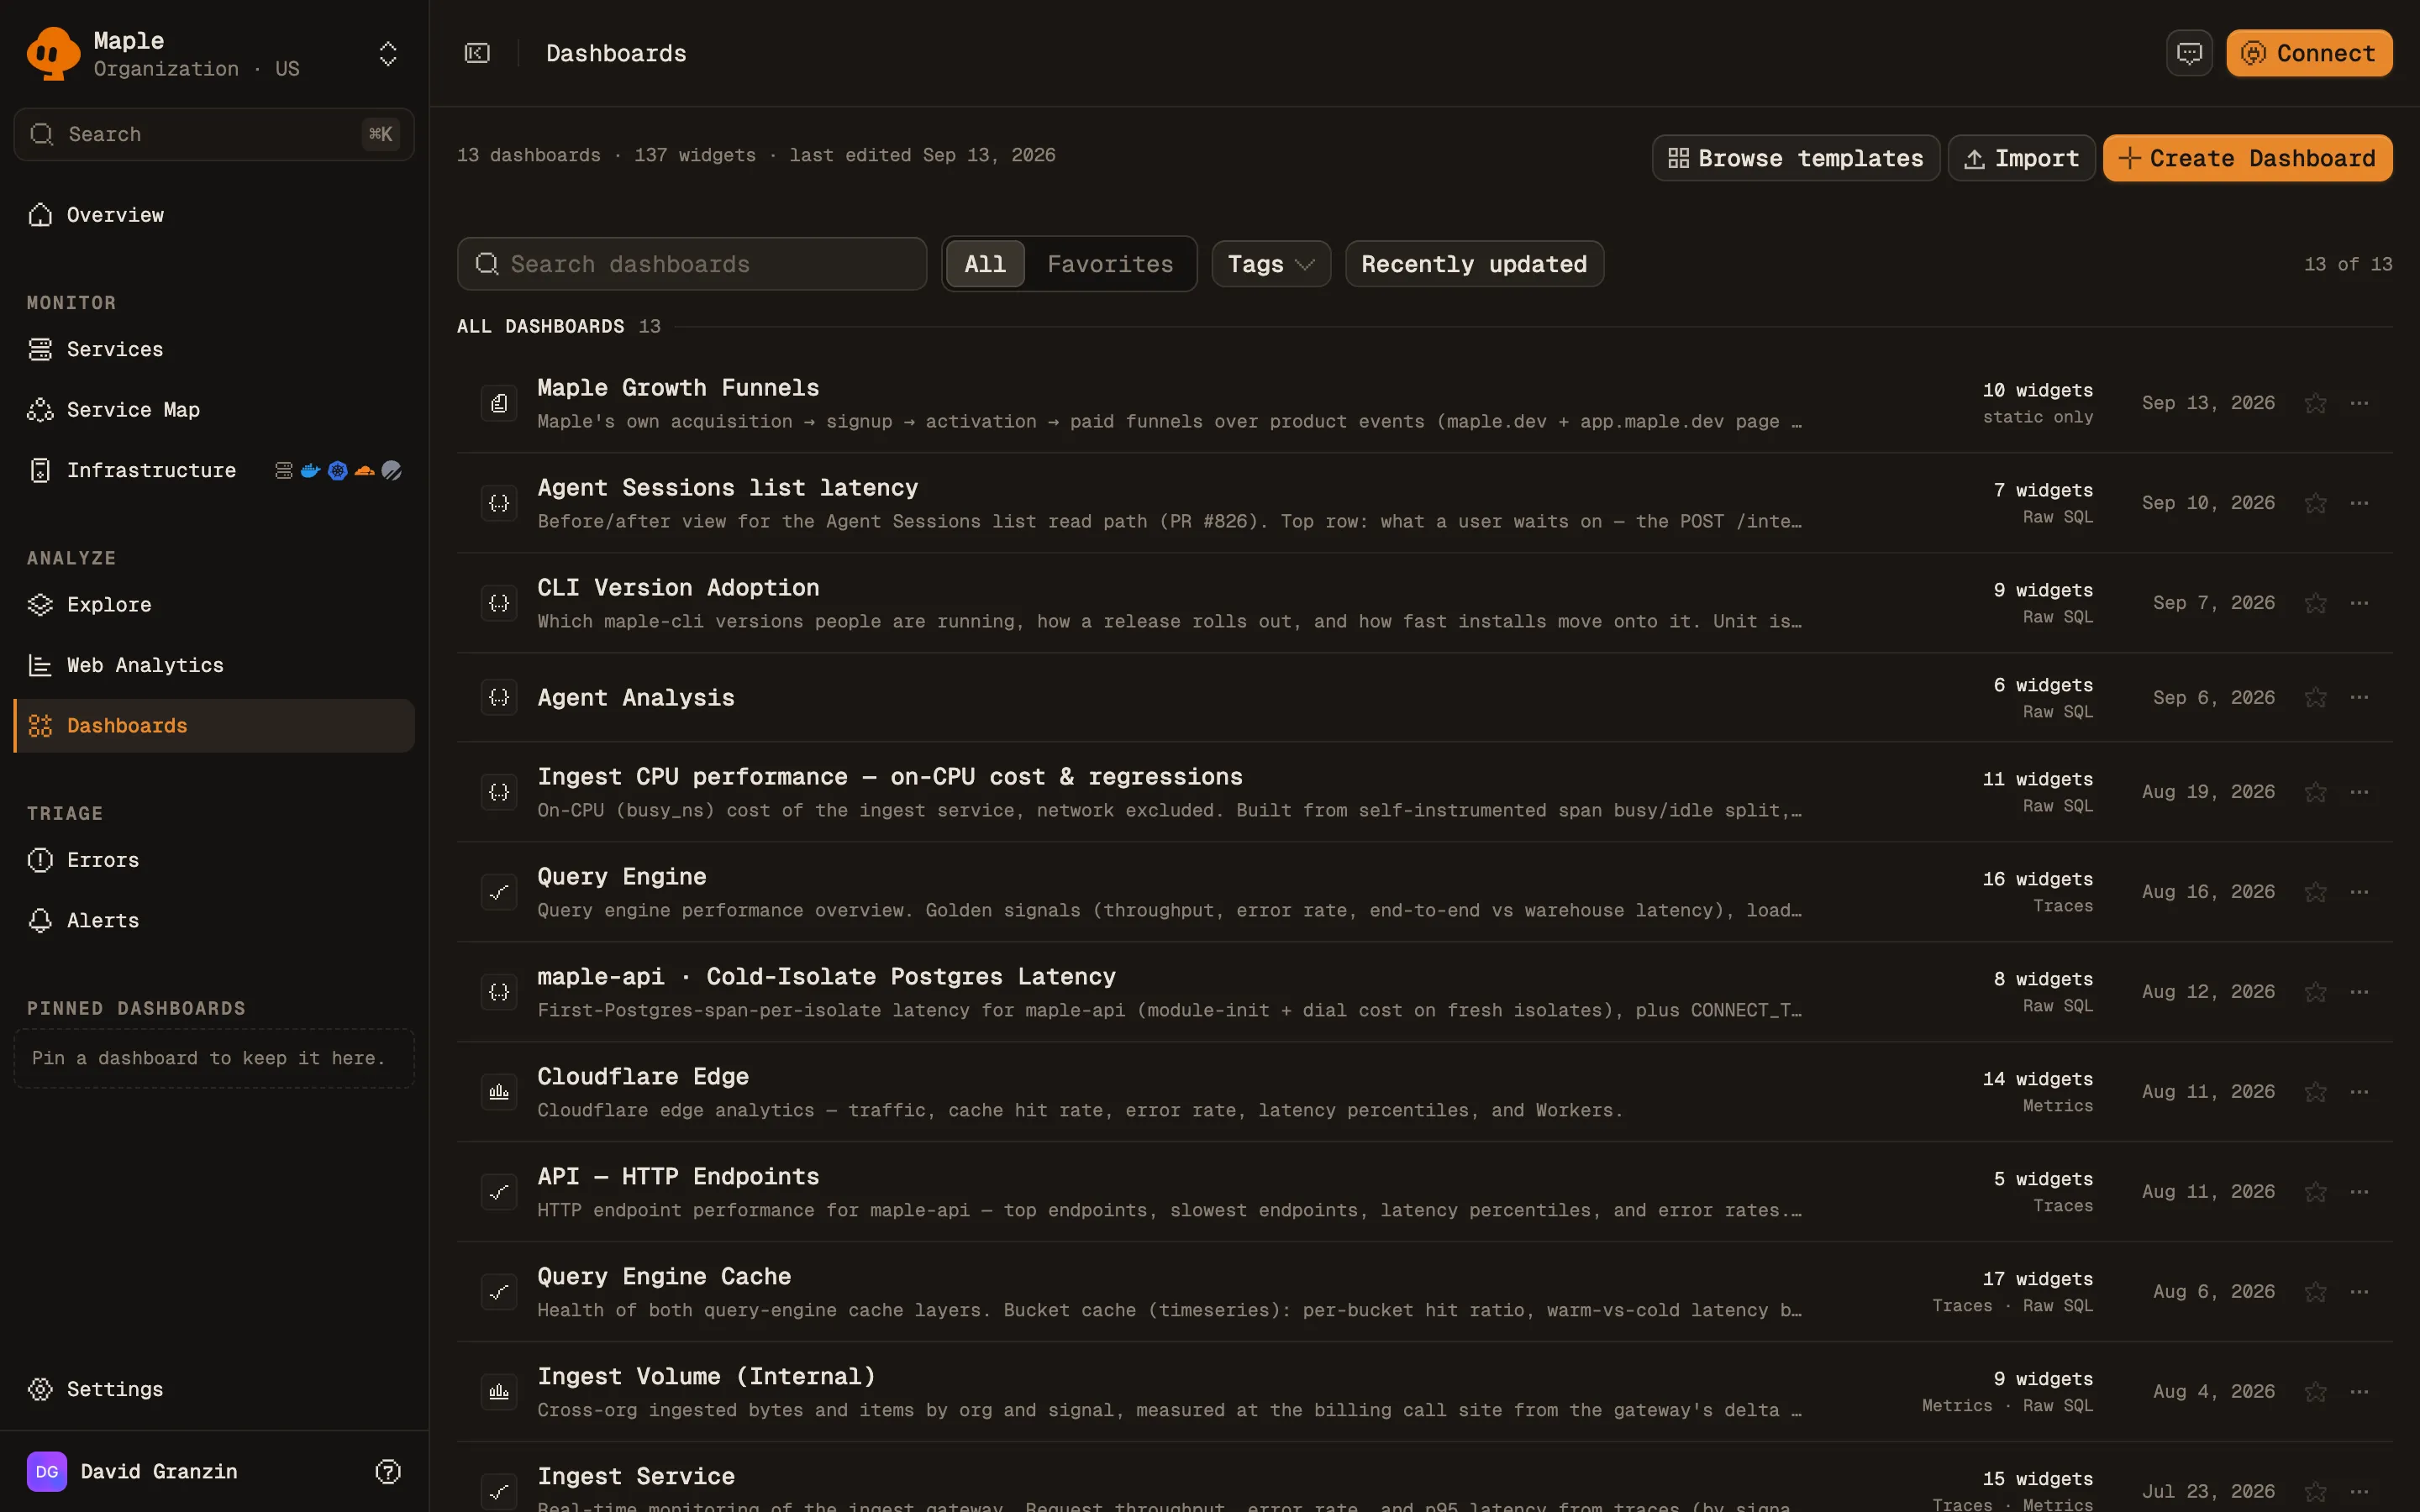
A new dashboard opens in edit mode. Click Add Widget to add the first widget.
Templates
Templates are ready-made dashboards for common setups:
| Group | Templates |
|---|---|
| Application | Service Health, HTTP Endpoints, gRPC Service, Error Tracking, Top Errors, Platform Overview, Metric Overview, Node.js Runtime, JVM Runtime, Blank Dashboard |
| Database | Postgres Overview, MySQL Overview, MongoDB Overview, Redis Overview |
| Messaging | Kafka Overview, NATS Overview, RabbitMQ Overview |
| Infrastructure | Host Metrics, Docker Containers, Kubernetes Cluster, Kubernetes Pods, Cloudflare Edge, PlanetScale Databases |
Pick a template to see a live preview on your own data and what it needs. Some templates take Parameters, such as a service name. Click Create dashboard to create your own copy, which you can edit or delete freely.
If the data a template needs is not arriving yet, the panel links to the setup for it. Create it anyway creates the dashboard now. Its widgets stay empty until the data arrives, then fill in on their own.
Add widgets
In edit mode, click Add Widget. The picker offers these widget types:
| Widget | Shows |
|---|---|
| Line, Area, Bar | A value over time, optionally split into series by a group-by. |
| Horizontal Bar | Values compared across groups. |
| Pie | Share of a total across groups. |
| Histogram, Heatmap | A distribution, such as request durations. |
| Stat | One number, such as the current error rate. |
| Gauge | One number against a range. |
| Table | Grouped values as rows. |
| List | Recent rows, such as the latest traces or log lines. |
| Funnel | Conversion through a sequence of product event steps. |
| Paths | The paths people take between product events. |
| Note | Markdown text, for headings, explanations and links. |
Most types come with presets you can start from. Pick one, then edit its query.
Queries
A widget’s editor has two tabs:
- Query Builder reads Traces, Logs, Metrics or Product events. Pick an aggregation, add filters and a group-by, and combine queries with a formula.
- Raw SQL runs your own SQL. The query must reference
$__orgFilter. See the SQL reference.
The preview updates as you edit. Save the widget to put it on the dashboard.
Arrange and manage widgets
In edit mode, drag widgets to move them and drag their corners to resize. From the ⋮ menu in the dashboard header:
- Auto Layout rearranges the widgets to fill the grid without gaps.
- Add group adds a titled section you can move widgets into.
- Variables and Tags open their editors.
Each widget’s ⋮ menu has Edit, Clone, Create alert, Embed chart and Delete. Create alert turns the widget’s query into an alert rule. Embed chart is covered in Embed dashboard charts.
Click Done to leave edit mode.
Variables
A variable adds a selector to the dashboard header. Widgets that reference it re-query when the selection changes. Add variables from ⋮ → Variables in edit mode.
| Type | Values |
|---|---|
| Query | Values from your telemetry: services, environments, or a span or resource attribute. |
| Custom | A fixed, comma-separated list you define. |
| Textbox | Free text, for example a search term. |
Each variable has a Name, an optional Label and Default value, and can include an All option. Reference it in a widget’s query as $name, for example $service.
The selected values are part of the URL (?var-service=checkout), so a link to the dashboard opens with the same selection.
Time range and refresh
The time range picker in the header applies to every widget. The refresh control reloads widgets on an interval, and the dashboard remembers its default interval.
Share a dashboard
Open ⋮ → Share… and pick who can open the dashboard’s link:
| Option | Who can view |
|---|---|
| Not shared | Members of your organization, inside Maple. |
| Anyone in this organization | Signed-in members of your organization, from the link. |
| Anyone with the link | Anyone who has the link, without signing in. They see the dashboard and its data. |
Replace issues a new link and stops the old one working. Shared views render query builder charts, raw SQL, notes, funnels, paths, and the errors, service and logs widgets. The dialog names any widget that will not render for viewers.
To put a single chart into another page, see Embed dashboard charts.
Find, export and restore
- Dashboards lists every dashboard, with search, sorting, and tags. Star a dashboard to add it to Favorites. Favorites are stored on your device.
- ⋮ → Export as JSON downloads the dashboard. Import on the Dashboards page loads it back, into this or another organization.
- ⋮ → Version history lists every saved version of the dashboard, so you can look at an earlier one and restore it.