# Traces
Search traces by service, route, status, duration, and any span or resource attribute, then open a trace to inspect its spans, logs, and session replay.
The **Traces** page lists the traces Maple received in the selected time range. Filter the list with sidebar facets or a query, then open a trace to see every span on a waterfall, timeline, or flow view. From a trace you can jump to its logs and to the session replay that produced it.
## What data it needs
Traces come from any OpenTelemetry SDK exporting spans over OTLP. The list and facets read these fields:
- `service.name` resource attribute for **Service**, and `deployment.environment` and `service.namespace` for **Environment** and **Namespace**.
- Span name for **Root Span**.
- Span status (`Ok`, `Error`, `Unset`) for **Has Error** and the **Status** column.
- `http.request.method` and `http.response.status_code` (or their older `http.method` and `http.status_code` spellings) for **HTTP Method** and **Status Code**.
See [OpenTelemetry conventions](/docs/concepts/otel-conventions) for the full list of attributes Maple reads.
## The trace list
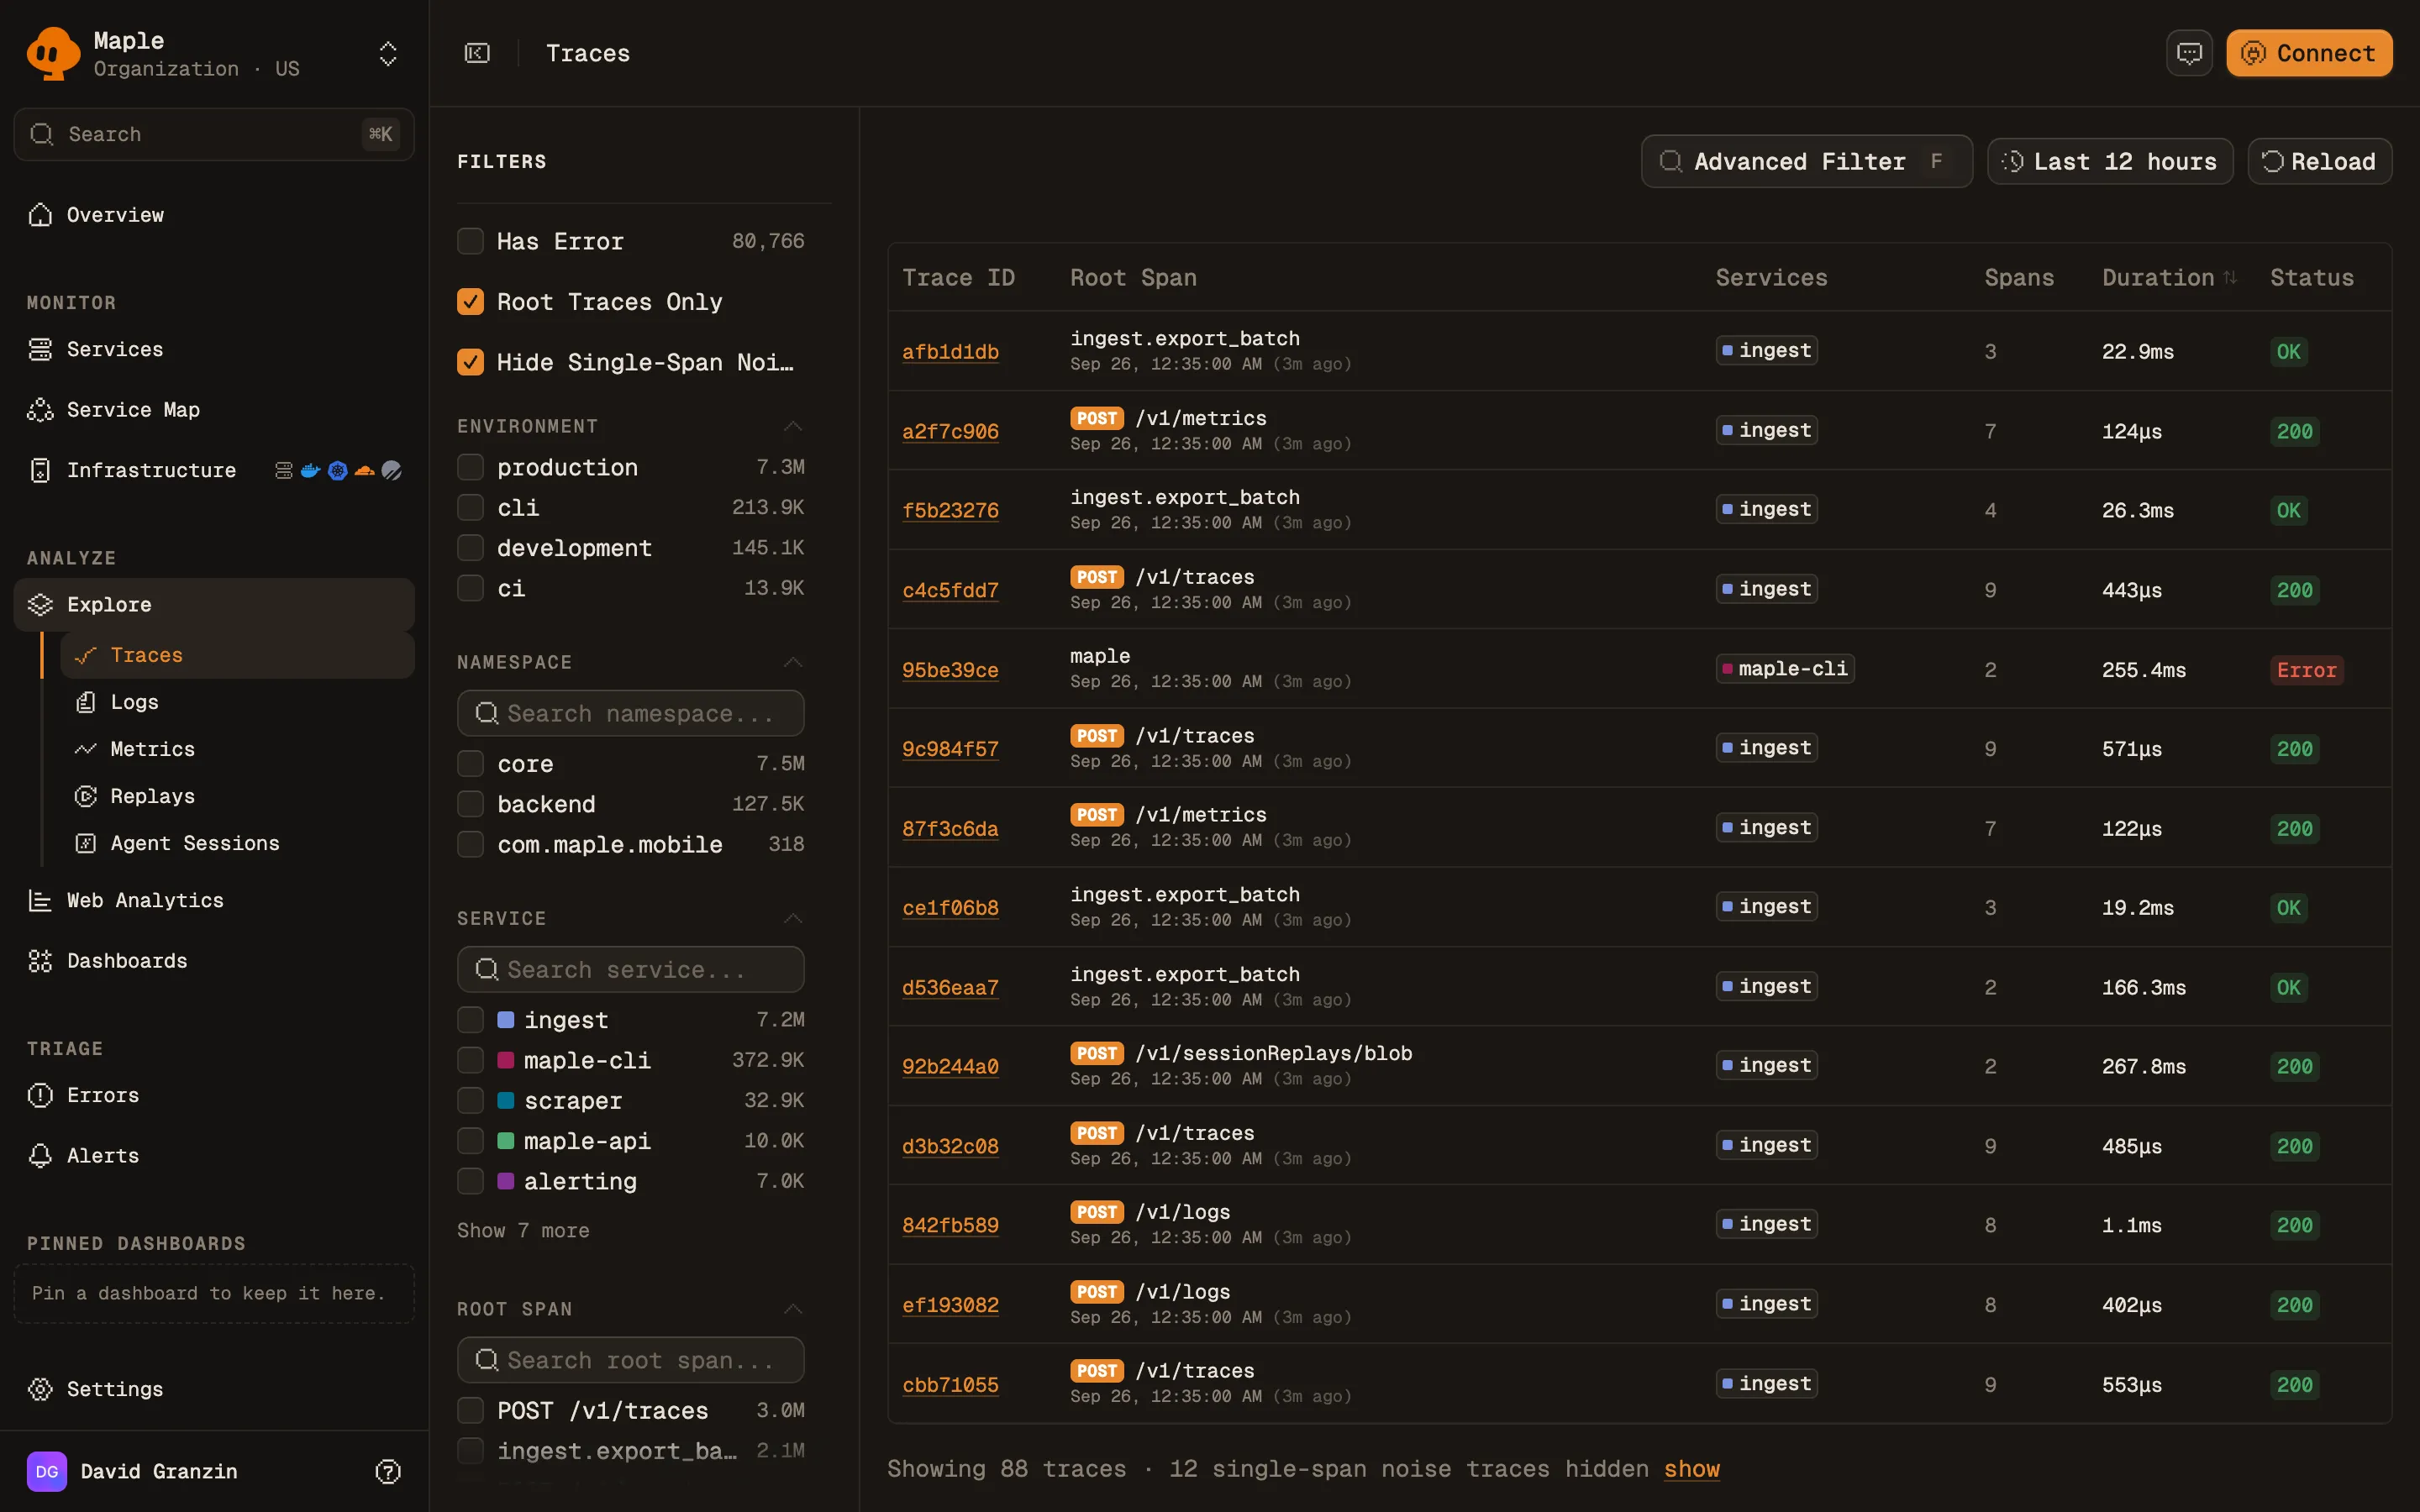
The table has these columns: **Trace ID**, **Root Span** (with start time), **Services**, **Spans**, **Duration**, and **Status**. **Status** shows the HTTP status code when the root span has one, otherwise the span status. Sort by clicking **Duration**. The default order is newest first. More rows load as you scroll.
The trace list with its facet sidebar. Counts next to each facet value cover the selected time range.
The default time range is the last 12 hours. Pick a preset from **Last 5 minutes** to **Last 1 month**, or set a custom range.
Click a row to open the trace in a side sheet. Use **Previous trace** and **Next trace** (or the `K` and `J` keys) to step through the list, and **Open trace** to go to the full page. Cmd-click or Ctrl-click opens the full page directly.
## Filter traces
### Sidebar facets
| Facet | What it does |
| -------------------------- | -------------------------------------------------------------------------------------------------------------------------------------------------- |
| **Has Error** | Only traces with an error span. |
| **Root Traces Only** | Lists one row per trace, keyed on its entry span (a root span, or a Server or Consumer span). On by default. Turn it off to list individual spans. |
| **Hide Single-Span Noise** | Hides single-span traces that are not entry points, such as orphaned client spans. On by default, shown while **Root Traces Only** is on. |
| **Environment** | Filter by `deployment.environment`. |
| **Namespace** | Filter by `service.namespace`. |
| **Service** | Filter by `service.name`. |
| **Root Span** | Filter by root span name. |
| **Duration** | A minimum and maximum duration range. |
| **HTTP Method** | Filter by request method. |
| **Status Code** | Filter by HTTP response status code. |
Every value facet can include or exclude a value.
### Query syntax
Click **Advanced Filter** (or press `F`) to write a query. Press Ctrl+Space for autocomplete and Cmd+Enter to apply.
```
service.name = "checkout" AND attr.http.route != "/health"
```
Join clauses with `AND`. Supported keys and operators:
| Key | Operators |
| -------------------------------------------------------------------------- | ----------------------------------------------------------------------------- |
| `service.name`, `span.name`, `deployment.environment`, `service.namespace` | `=`, `!=`, `contains` |
| `http.method`, `http.status_code` | `=`, `!=` |
| `has_error`, `root_only`, `min_duration_ms`, `max_duration_ms` | `=` |
| `attr.` (span attribute), `resource.` (resource attribute) | `=`, `!=`, `contains`, `!contains`, `exists`, `!exists`, `>`, `>=`, `<`, `<=` |
You can use up to 5 filters per attribute map (span or resource). The dialog shows a warning for any clause the list cannot apply.
## Inspect a trace
The trace page header shows the environment, the commit SHA (from `vcs.ref.head.revision`), the error state, and the HTTP status. If the trace produced [product events](/docs/product-events/overview), they appear in a **Product events** panel.
Three views show the spans:
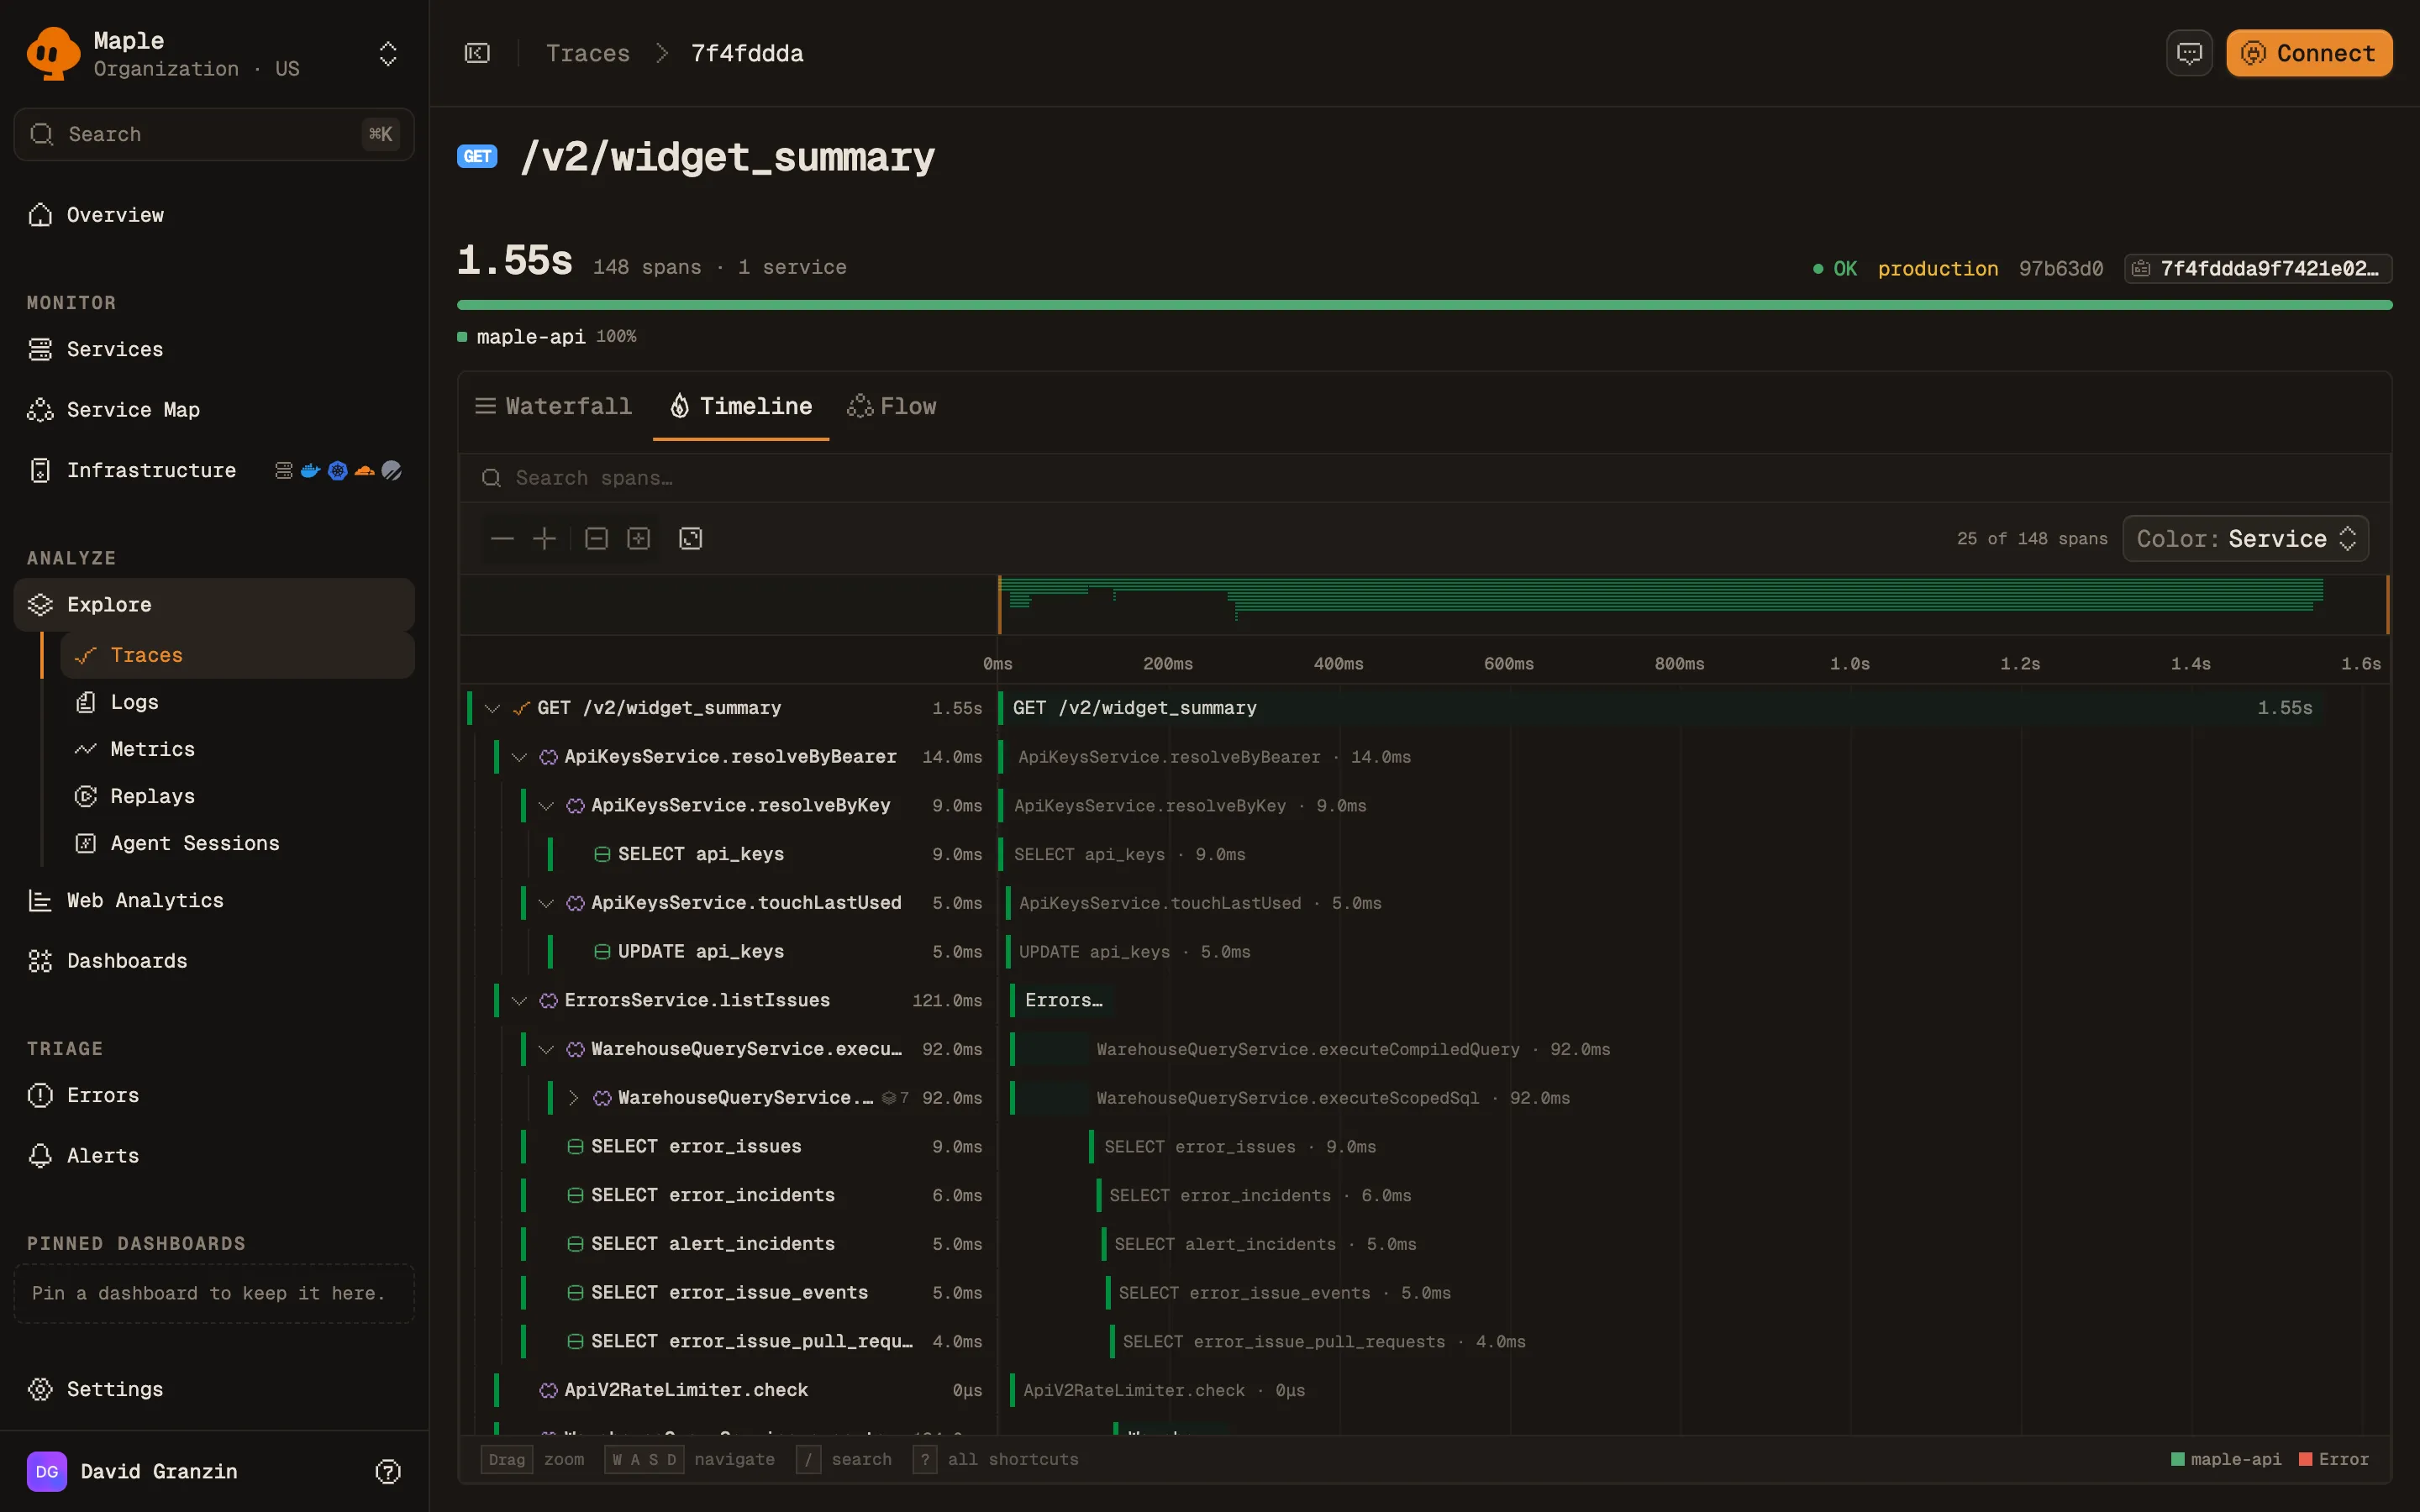
- **Timeline** (default): spans on a time axis, with **Search spans…** and a color-by picker.
- **Waterfall**: the span tree with a duration bar per span.
- **Flow**: spans as a graph of nodes and edges, with repeated child spans combined into one card with a count.
A trace on the Timeline view, with nested database and warehouse spans.
Click a span to open the span panel. Press Esc to close it. The selected span is kept in the URL, so you can share a link to it.
The span panel shows the duration and status, and an error section when the status is `Error`. It has these tabs:
- **Details**: **Start Time**, **Span ID**, **Parent Span ID**, then **Span Attributes** and **Resource Attributes**. Each attribute row has **Filter by** and **Exclude** actions that open the trace list with that attribute filter applied.
- **Logs**: logs emitted inside this span. Click one to open its detail.
- **Infrastructure**: host, container, or Kubernetes details, shown when the span carries those resource attributes.
## Jump to logs and replays
- **View Logs** in the trace header opens the [Logs](/docs/explore/logs) page scoped to the trace ID. The button shows a count and appears only when the trace has logs. The time window covers the trace duration plus 5 minutes on either side.
- **View Session Replay** opens the [replay](/docs/session-replay/replays) of the browser session that made the request. It appears when a recorded session is linked to this trace ID by the [browser SDK](/docs/session-replay/browser-sdk).
## Query traces from an assistant
The [MCP server](/docs/reference/mcp) exposes the same data:
- `search_traces`: filter by service, error, duration, HTTP method, span name, or one attribute key and value.
- `inspect_trace`: the span tree and logs for one trace ID.
- `inspect_span`: every attribute of one span.
- `find_slow_traces`: the slowest traces with p50 and p95 context.
## Troubleshooting
- **"No traces yet".** Maple has never received a span for this organization. Configure an OpenTelemetry SDK with your ingest key and the [ingest endpoint](/docs/reference/ingest). See [Instrumentation](/docs/instrumentation).
- **"No traces in this time range".** Maple has data, just not in this window. Click **Widen time range**.
- **"No traces match these filters".** Your exclusions removed everything. Click **Clear filters**.
- **A trace you expect is missing.** **Root Traces Only** and **Hide Single-Span Noise** are on by default. Turn off **Hide Single-Span Noise** to see single-span traces, or **Root Traces Only** to search individual spans.
- **"Trace not found".** The trace has expired past your [retention](/docs/reference/retention) or has not been ingested yet.
## Next steps
- [Logs](/docs/explore/logs): search log lines and jump back to their traces.
- [Services](/docs/explore/services): latency, throughput, and errors per service.
- [OpenTelemetry conventions](/docs/concepts/otel-conventions): attributes that power filters and badges.