
Pino is a structured logger for Node.js. It writes every log entry as one line of JSON with a level, a timestamp and any fields you pass, and it is designed to add as little overhead as possible to your application.
This guide covers installing Pino and writing your first logs, configuring it for production, logging HTTP requests with pino-http or Fastify, adding trace IDs with OpenTelemetry, and how Pino compares with Winston.
Key takeaways
- Pass data as an object first:
logger.info({ orderId }, "order created")gives you a field to search. - A child logger adds a request ID or tenant to every line it writes.
- List secret paths in
redact; a token under an unlisted key still goes out in clear text. - Use
pino-prettyin development only and keep production output as JSON. - With the OpenTelemetry Pino instrumentation, each line carries the trace ID of the request that wrote it.
01 · Definition
Pino, the JSON logger for Node.js
JSON lines suit services that run in containers or on platforms that collect stdout: whatever reads the output can filter on fields instead of matching text. Pino is MIT-licensed, Fastify uses it as its built-in logger, and pino-http adds request logging to Express and plain http servers.
Every call takes the same path. On the thread that runs your code, Pino drops calls below the configured level and turns the rest into a JSON line. Where the line goes next depends on your setup:
A destination and a transport are alternatives. The OpenTelemetry path is added on top of either one, so the line still reaches stdout or your transport.
02 · Setup
Install Pino and write the first logs
The first log line
Pino is one package and needs no configuration to start:
npm install pinopnpm add pinobun add pinoRunnode app.ts # Node 22.18+, in a package with "type": "module"
// app.ts
import pino, { type Logger } from "pino"

const logger: Logger = pino()

logger.info("server started")
logger.info({ port: 3000 }, "listening")
logger.info("user %s signed in after %d ms", "ada", 42)
logger.error(new Error("connection refused"), "payment provider unreachable")Runnode app.mjs
// app.mjs
import pino from "pino"

const logger = pino()

logger.info("server started")
logger.info({ port: 3000 }, "listening")
logger.info("user %s signed in after %d ms", "ada", 42)
logger.error(new Error("connection refused"), "payment provider unreachable")Runnode app.cjs
// app.cjs
const pino = require("pino")

const logger = pino()

logger.info("server started")
logger.info({ port: 3000 }, "listening")
logger.info("user %s signed in after %d ms", "ada", 42)
logger.error(new Error("connection refused"), "payment provider unreachable")
Output
{"level":30,"time":1792513464618,"pid":4812,"hostname":"api-1","msg":"server started"}
{"level":30,"time":1792513464619,"pid":4812,"hostname":"api-1","port":3000,"msg":"listening"}
{"level":30,"time":1792513464619,"pid":4812,"hostname":"api-1","msg":"user ada signed in after 42 ms"}
{"level":50,"time":1792513464619,"pid":4812,"hostname":"api-1","err":{"type":"Error","message":"connection refused","stack":"Error: connection refused\n    at file:///srv/app.ts:8:14 ..."},"msg":"payment provider unreachable"}
Each method takes an optional object first and the message second. The object's keys become top-level fields of the line, which is what lets you filter on port later. Arguments after the message fill %s, %d and %o placeholders, and an Error passed first is written under err with its type, message and stack.
Put data in the object, not in the message. logger.info({ orderId }, "order created") gives you an orderId field to search; a template string gives you text to parse back.
Pino log levels
Pino writes the level as a number. A call below the logger's level returns before any serialization, so a disabled debug call costs almost nothing.
| Level | Value | Use it for |
|---|---|---|
| fatal | 60 | The process is about to exit. |
| error | 50 | A request or job failed and someone may need to act. |
| warn | 40 | Something went wrong and the code recovered: a retry, a fallback. |
| info | 30 | The default. Lifecycle events and one line per unit of work. |
| debug | 20 | Detail you turn on while investigating. |
| trace | 10 | Very verbose output, usually only on your machine. |
The default is info, and silent turns logging off, for example in tests. Read the level from an environment variable so one deploy can run at debug without a code change:
const logger = pino({ level: process.env.LOG_LEVEL ?? "info" })

logger.debug("dropped: debug is below info")

logger.level = "debug" // change it at runtime, for example from an admin endpoint
logger.debug("written now")

if (logger.isLevelEnabled("trace")) {
  logger.trace({ memory: process.memoryUsage() }, "memory snapshot")
}
A disabled call still evaluates its arguments, so wrap expensive ones in isLevelEnabled(). The customLevels option adds levels with your own names and numbers.
Child loggers
logger.child(bindings) returns a logger that adds the same fields to every line it writes. Pino serializes the bindings once, when the child is created, so a child per request is cheap.
const logger = pino()

const billing = logger.child({ module: "billing" })
const log = billing.child({ requestId: "req_8f2c" })

log.warn({ invoiceId: "inv_1042" }, "invoice overdue")

const db = logger.child({ module: "db" }, { level: "warn" })
db.info("not written: this child only logs warn and above")
Output
{"level":40,"time":1792513481449,"pid":4812,"hostname":"api-1","module":"billing","requestId":"req_8f2c","invoiceId":"inv_1042","msg":"invoice overdue"}
The usual pattern is one child per request or job, carrying a request ID or tenant, passed to the code that handles it. The second argument to child() overrides level, redact, serializers or msgPrefix for that child only.
03 · Production
Configure Pino for production
Redact secrets and trim objects
redact replaces values at the paths you list before the line is written. Paths use dot and bracket notation, [*] matches every array element, and keys with hyphens need brackets. A serializer is a function keyed by a top-level field name: when a line has that field, Pino writes the function's return value instead of the object.
const logger = pino({
  redact: {
    paths: ["password", "req.headers.authorization", 'req.headers["x-api-key"]', "cards[*].number"],
    censor: "[REDACTED]",
  },
  serializers: {
    user: (user) => ({ id: user.id, plan: user.plan }),
  },
})

logger.info({ password: "hunter2", cards: [{ number: "4242424242424242", brand: "visa" }] }, "signup")
logger.info({ user: { id: "u_1", plan: "pro", email: "ada@example.com" } }, "loaded user")
Output
{"level":30,...,"password":"[REDACTED]","cards":[{"number":"[REDACTED]","brand":"visa"}],"msg":"signup"}
{"level":30,...,"user":{"id":"u_1","plan":"pro"},"msg":"loaded user"}
The default censor is "[Redacted]"; remove: true drops the key instead. Redaction only covers the paths you list, so a token under a new key name goes out in clear text. Logging whole request bodies is the larger risk, and a serializer that picks a few fields avoids it. pino.stdSerializers provides err, req and res; err is on by default.
pino-pretty in development only
pino-pretty turns JSON lines into colored, readable ones. Install it as a dev dependency and load it as a transport only when NODE_ENV is development, so a production install without dev dependencies never asks for it:
npm install --save-dev pino-prettypnpm add -D pino-prettybun add --dev pino-prettyconst logger = pino({
level: process.env.LOG_LEVEL ?? "info",
transport:
process.env.NODE_ENV === "development"
? {
target: "pino-pretty",
options: { colorize: true, translateTime: "SYS:HH:MM:ss", ignore: "pid,hostname" },
}
: undefined,
})Output
[18:24:50] INFO: listening
    port: 3000
Or leave the code alone and pipe the output through the CLI, which takes the same options as flags:
node app.ts | npx pino-pretty -c -t "SYS:HH:MM:ss" -i pid,hostnamenode app.ts | pnpm exec pino-pretty -c -t "SYS:HH:MM:ss" -i pid,hostnamenode app.ts | bunx pino-pretty -c -t "SYS:HH:MM:ss" -i pid,hostnameThe pino-pretty README advises against running it in production: keep production output as JSON so the tool that collects it can read the fields.
Transports run in a worker thread
A transport is a module that receives Pino's lines and writes them somewhere. pino.transport() starts it in a worker thread, so formatting and network I/O don't compete with request handling. With targets, one logger feeds several transports, each with its own minimum level:
const transport = pino.transport({
  targets: [
    { target: "pino-pretty", level: "info", options: { colorize: true } },
    { target: "pino/file", level: "debug", options: { destination: "./logs/app.log", mkdir: true } },
  ],
})

const logger = pino({ level: "debug" }, transport)

logger.debug("only in the file")
logger.info({ orderId: "ord_77" }, "in the terminal and in the file")targetis a package name or an absolute path to your own module.pino/fileships with Pino.- A target without a
levelgetsinfo. The logger's level applies first, so set it to the lowest level any target needs:debugin the example. optionsis copied to the worker, so it cannot contain functions.- Pino flushes the worker on a normal exit. The Pino docs treat an
'error'event from a transport as fatal.
Sync, async and buffered writes
Without a transport, Pino writes on the main thread through a destination built on sonic-boom. pino.destination() changes where it writes and when:
// Collect 4 KiB before each write: more throughput, and a crash can lose the last buffer.
const logger = pino(pino.destination({ dest: "./logs/app.log", minLength: 4096, mkdir: true }))

// Block on every write: nothing is pending when the function returns.
const lambdaLogger = pino(pino.destination({ sync: true }))| Setting | Runs on | Behaviour | Use it when |
|---|---|---|---|
| Default destination | Main thread | Hands each line to stdout without blocking or buffering | Most services |
minLength: 4096 | Main thread | Collects 4 KiB, then writes | Very high volume, where losing the last buffer on a crash is acceptable |
sync: true | Main thread | Blocks until each write completes | AWS Lambda and other runtimes that freeze the process after a response |
pino.transport() | Worker thread | Formatting and I/O move to a worker | Pretty printing, several files, sending over the network |
Pino's docs note that buffered logging in Lambda tends to delay or lose lines, because the runtime freezes the process before the buffer is written.
04 · HTTP
Log HTTP requests with pino-http or Fastify
A request log needs one line per request with its status and duration, plus a per-request child logger so every line a handler writes carries the same request ID. Express gets both from pino-http; Fastify has them built in.
npm install express pino pino-httppnpm add express pino pino-httpbun add express pino pino-http// server.mjs
import express from "express"
import pino from "pino"
import { pinoHttp } from "pino-http"
const logger = pino({
level: process.env.LOG_LEVEL ?? "info",
redact: ["req.headers.authorization", "req.headers.cookie"],
})
const app = express()
app.use(
pinoHttp({
logger,
quietReqLogger: true,
customLogLevel: (req, res, err) =>
err || res.statusCode >= 500 ? "error" : res.statusCode >= 400 ? "warn" : "info",
}),
)
app.get("/orders/:id", (req, res) => {
req.log.info({ orderId: req.params.id }, "loading order")
res.json({ id: req.params.id })
})
app.listen(3000, () => logger.info({ port: 3000 }, "listening"))pino-http writes one request completed line per request with the request, the status code and responseTime in milliseconds. Its default request serializer includes every header, which is why the logger redacts authorization and cookie. quietReqLogger keeps the lines your handlers write down to a reqId instead of the whole request, and customLogLevel logs 4xx as warn and 5xx as error. The older express-pino-logger package is deprecated in favour of pino-http.
npm install fastifypnpm add fastifybun add fastify// server.mjs
import Fastify from "fastify"
const app = Fastify({
logger: { level: process.env.LOG_LEVEL ?? "info" },
})
app.get("/orders/:id", async (request) => {
request.log.info({ orderId: request.params.id }, "loading order")
return { id: request.params.id }
})
await app.listen({ port: 3000 })Fastify depends on Pino and builds the logger from its logger option, which takes true or any Pino options, including redact and transport. It writes incoming request and request completed lines with a reqId, and its default request serializer logs no headers. To pass a Pino instance you created yourself, Fastify 5 has a separate loggerInstance option.
Both servers write the handler's line with the request ID and the orderId field. The next section adds the trace ID to that same line.
05 · Correlation
Trace IDs and Pino logs in Maple
A line that says payment provider unreachable is more useful when you can open the request it came from. The OpenTelemetry pino instrumentation does two things, with no change to your logging calls:
- Lines written inside an active span get trace_id, span_id and trace_flags fields.
- Pino's output is split in two: one copy goes to your destination or transport as before, the other to the OpenTelemetry log SDK, which batches the records and exports them over OTLP. This needs Pino 7 or later.
Start the OpenTelemetry SDK
The instrumentation is part of @opentelemetry/auto-instrumentations-node, so the standard Node.js SDK setup turns it on. Install the SDK packages:
npm install @opentelemetry/api \
  @opentelemetry/sdk-node \
  @opentelemetry/auto-instrumentations-node \
  @opentelemetry/instrumentation \
  import-in-the-middle \
  @opentelemetry/resources \
  @opentelemetry/sdk-logs \
  @opentelemetry/sdk-metrics \
  @opentelemetry/exporter-trace-otlp-proto \
  @opentelemetry/exporter-logs-otlp-proto \
  @opentelemetry/exporter-metrics-otlp-proto
pnpm add @opentelemetry/api \
@opentelemetry/sdk-node \
@opentelemetry/auto-instrumentations-node \
@opentelemetry/instrumentation \
import-in-the-middle \
@opentelemetry/resources \
@opentelemetry/sdk-logs \
@opentelemetry/sdk-metrics \
@opentelemetry/exporter-trace-otlp-proto \
@opentelemetry/exporter-logs-otlp-proto \
@opentelemetry/exporter-metrics-otlp-protobun add @opentelemetry/api \
@opentelemetry/sdk-node \
@opentelemetry/auto-instrumentations-node \
@opentelemetry/instrumentation \
import-in-the-middle \
@opentelemetry/resources \
@opentelemetry/sdk-logs \
@opentelemetry/sdk-metrics \
@opentelemetry/exporter-trace-otlp-proto \
@opentelemetry/exporter-logs-otlp-proto \
@opentelemetry/exporter-metrics-otlp-proto
Create tracing.mjs next to server.mjs. It starts the SDK before your code loads Pino, which is what lets the instrumentation patch it. MAPLE_KEY is an ingest key from Maple, covered in the Maple steps below.
// tracing.mjs
import { register } from "import-in-the-middle/register-hooks.mjs"
import { NodeSDK } from "@opentelemetry/sdk-node"
import { getNodeAutoInstrumentations } from "@opentelemetry/auto-instrumentations-node"
import { resourceFromAttributes } from "@opentelemetry/resources"
import { BatchLogRecordProcessor } from "@opentelemetry/sdk-logs"
import { PeriodicExportingMetricReader } from "@opentelemetry/sdk-metrics"
import { OTLPTraceExporter } from "@opentelemetry/exporter-trace-otlp-proto"
import { OTLPLogExporter } from "@opentelemetry/exporter-logs-otlp-proto"
import { OTLPMetricExporter } from "@opentelemetry/exporter-metrics-otlp-proto"

// Lets the instrumentations patch ES modules. CommonJS apps can drop this line.
register()

const MAPLE_ENDPOINT = "https://ingest.maple.dev" // EU: https://ingest.eu.maple.dev
const MAPLE_KEY = "YOUR_INGEST_KEY"
const headers = { authorization: `Bearer ${MAPLE_KEY}` }

const sdk = new NodeSDK({
  resource: resourceFromAttributes({ "service.name": "orders-api" }),
  traceExporter: new OTLPTraceExporter({ url: `${MAPLE_ENDPOINT}/v1/traces`, headers }),
  logRecordProcessors: [
    new BatchLogRecordProcessor({
      exporter: new OTLPLogExporter({ url: `${MAPLE_ENDPOINT}/v1/logs`, headers }),
    }),
  ],
  metricReaders: [
    new PeriodicExportingMetricReader({
      exporter: new OTLPMetricExporter({ url: `${MAPLE_ENDPOINT}/v1/metrics`, headers }),
    }),
  ],
  instrumentations: [getNodeAutoInstrumentations()],
})

sdk.start()

process.on("SIGTERM", () => {
  sdk.shutdown().finally(() => process.exit(0))
})
Check the BatchLogRecordProcessor signature
Current @opentelemetry/sdk-logs releases take an options object, new BatchLogRecordProcessor({ exporter }). Older releases took the exporter as the first argument. Passing an exporter to a release that expects the object raises no error, and no log record leaves the process, so check the installed .d.ts if logs never arrive.
The register() import needs Node.js 22.22.3+, 24.11.1+ or 26+. On an older Node.js, import register from node:module and call register("@opentelemetry/instrumentation/hook.mjs", import.meta.url) instead.
An ingest key can only write telemetry to your organization; it cannot read data. To keep it out of source anyway, the SDK can take its whole configuration from the standard OTEL_* variables, as in the Node.js guide's environment variables section.
The same line, with a trace ID
Load tracing.mjs ahead of either server from the HTTP section:
node --import ./tracing.mjs server.mjsOutput
{"level":30,"time":1792513527238,"pid":4812,"hostname":"api-1","reqId":1,"trace_id":"0c8fecc47de79cc6181bbc93a912d762","span_id":"22497105575e6deb","trace_flags":"01","orderId":"42","msg":"loading order"}
Stdout now carries the trace context. The exported copy uses Pino's level name as the severity text, with the matching OpenTelemetry severity number, and your fields, such as orderId and reqId, become log attributes. It leaves out pid, hostname and the trace fields, which the resource and the record's trace context already carry. Lines written outside a span, such as the startup listening line, are exported without a trace ID.
The export receives every line the logger writes, whatever the per-target levels of a pino.transport(). To keep the trace IDs and ship logs another way, turn log sending off in tracing.mjs:
instrumentations: [
  getNodeAutoInstrumentations({
    "@opentelemetry/instrumentation-pino": { disableLogSending: true },
  }),
],
Find the logs in Maple
- 01
Create an ingest key
Open Settings → Ingestion and copy the private key (
maple_sk_...). Use it asMAPLE_KEYintracing.mjs, and switchMAPLE_ENDPOINTto the EU host if your organization is in the EU region. - 02
Filter the Logs page
Start the server with the SDK and send it a few requests. In Logs, filter Service to
orders-api. The Severity filter lists Pino's level names. Paste a trace ID into the search box to see every line from one request.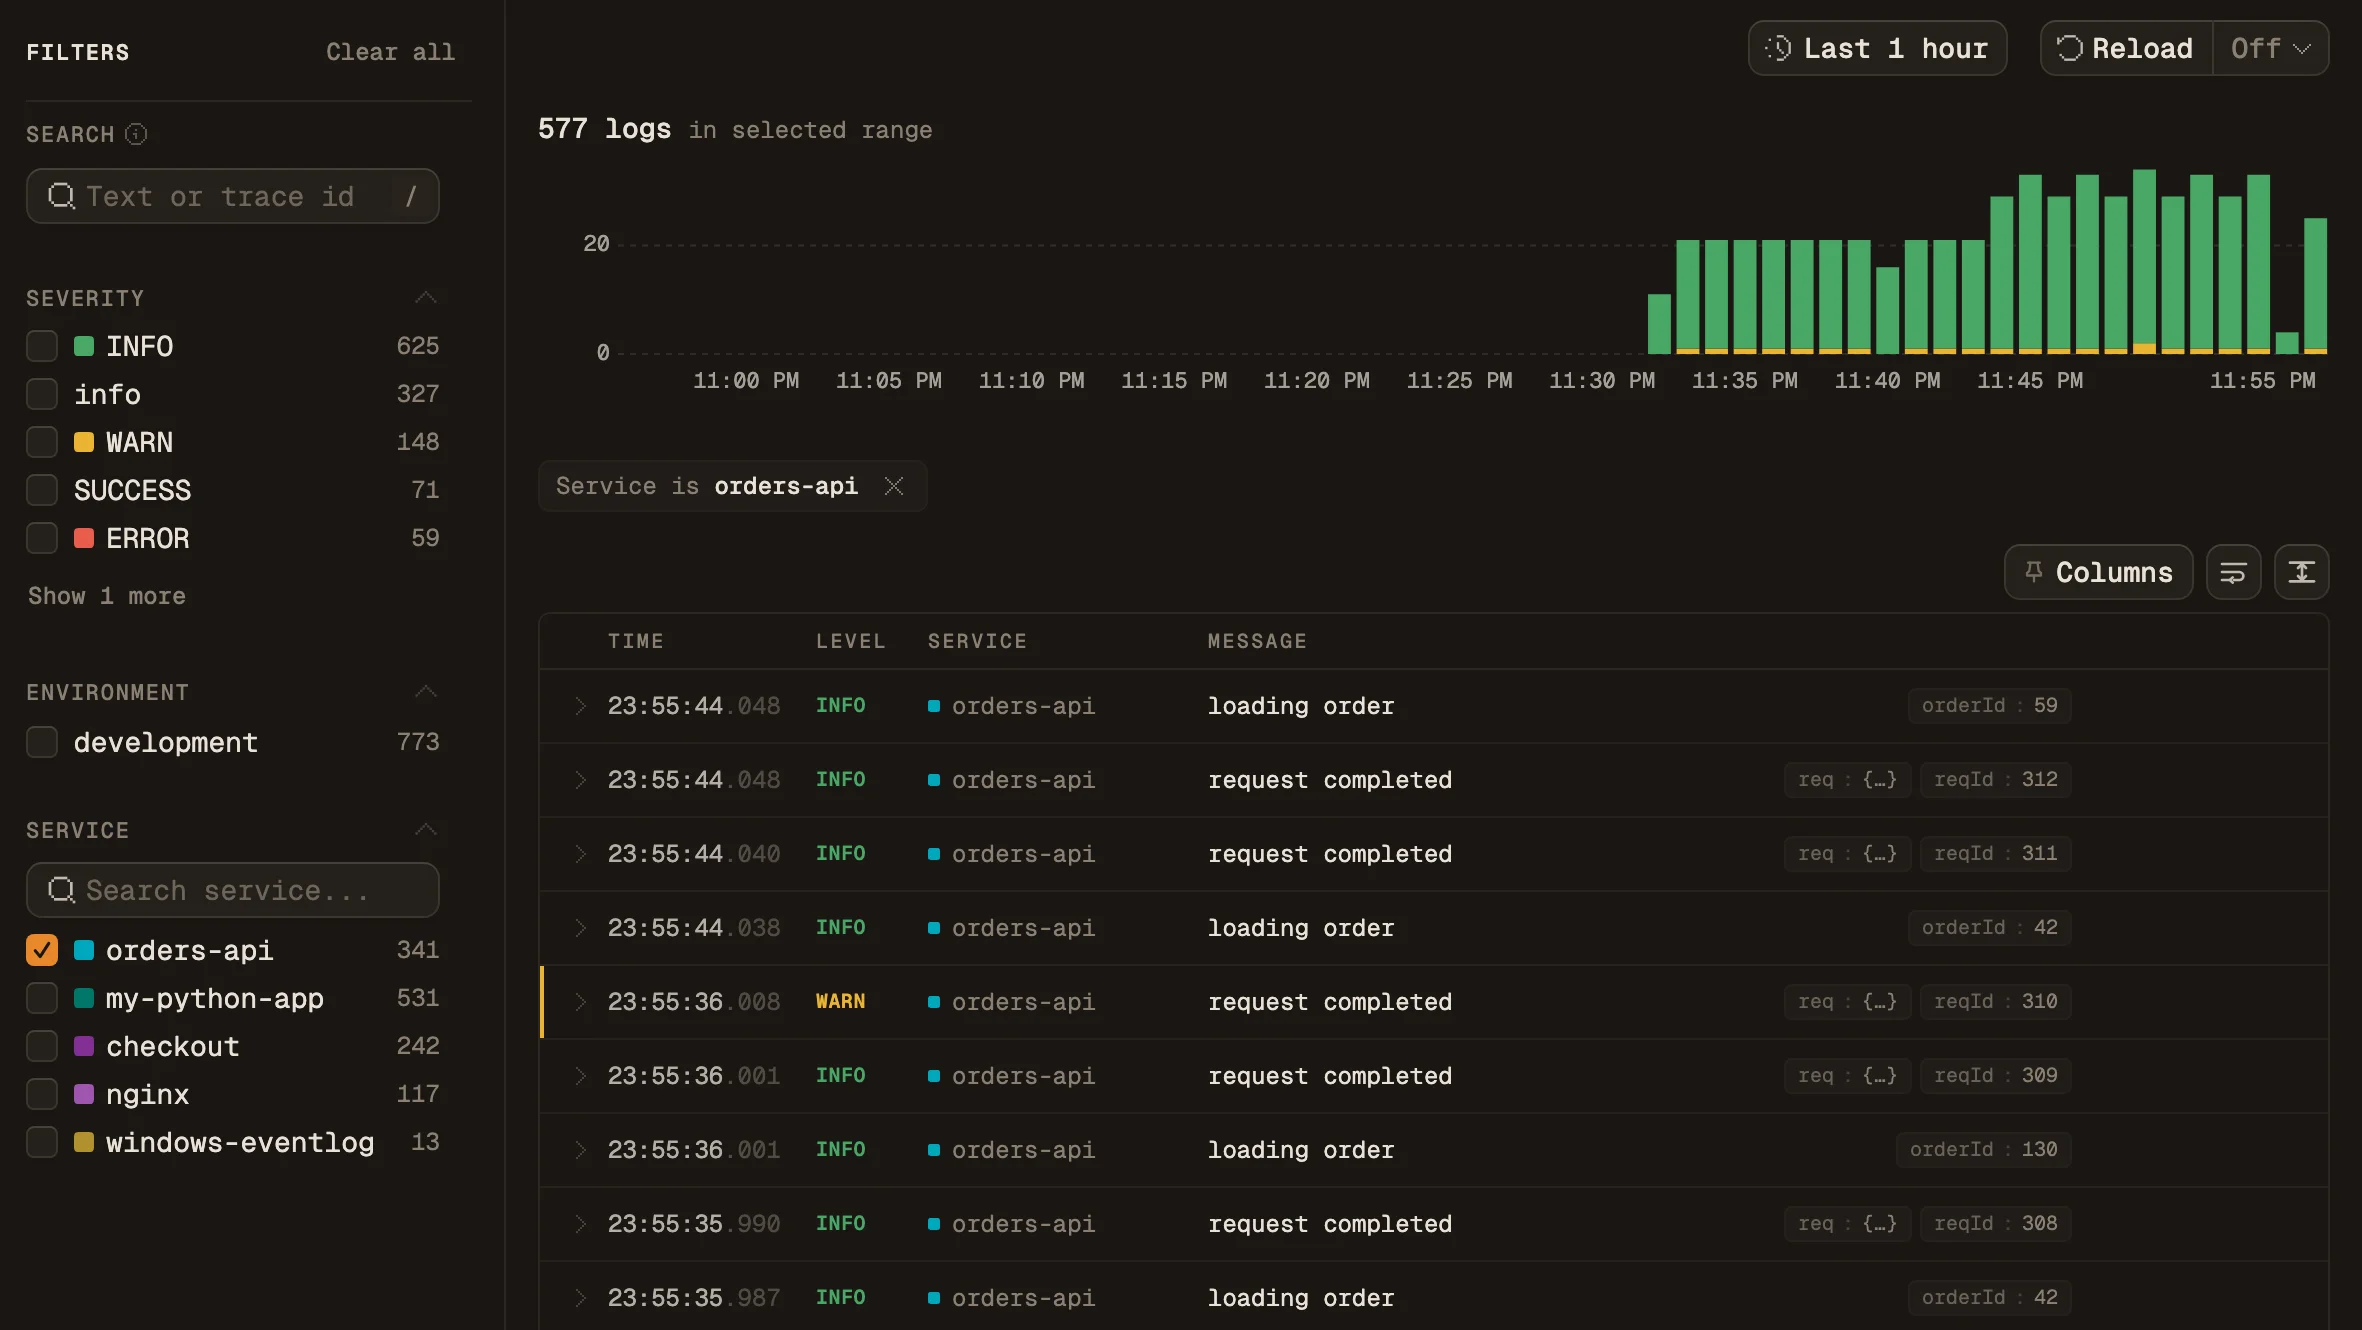
- 03
Open a line
Click a
loading orderrow, then Open detail. Attributes showsorderIdandreqId, and the meta strip shows thetrace:link and span ID.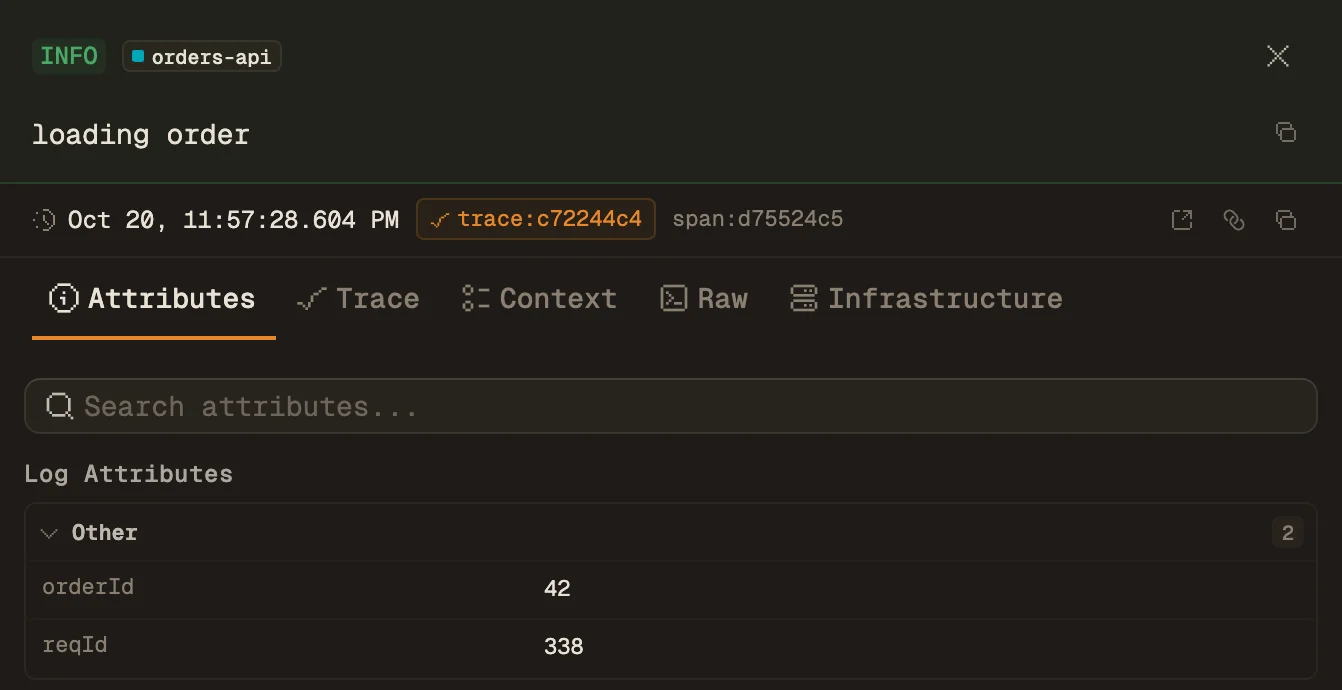
- 04
Move to the trace
Click the
trace:link to open the request's spans at the log's timestamp. From a trace, View Logs goes the other way.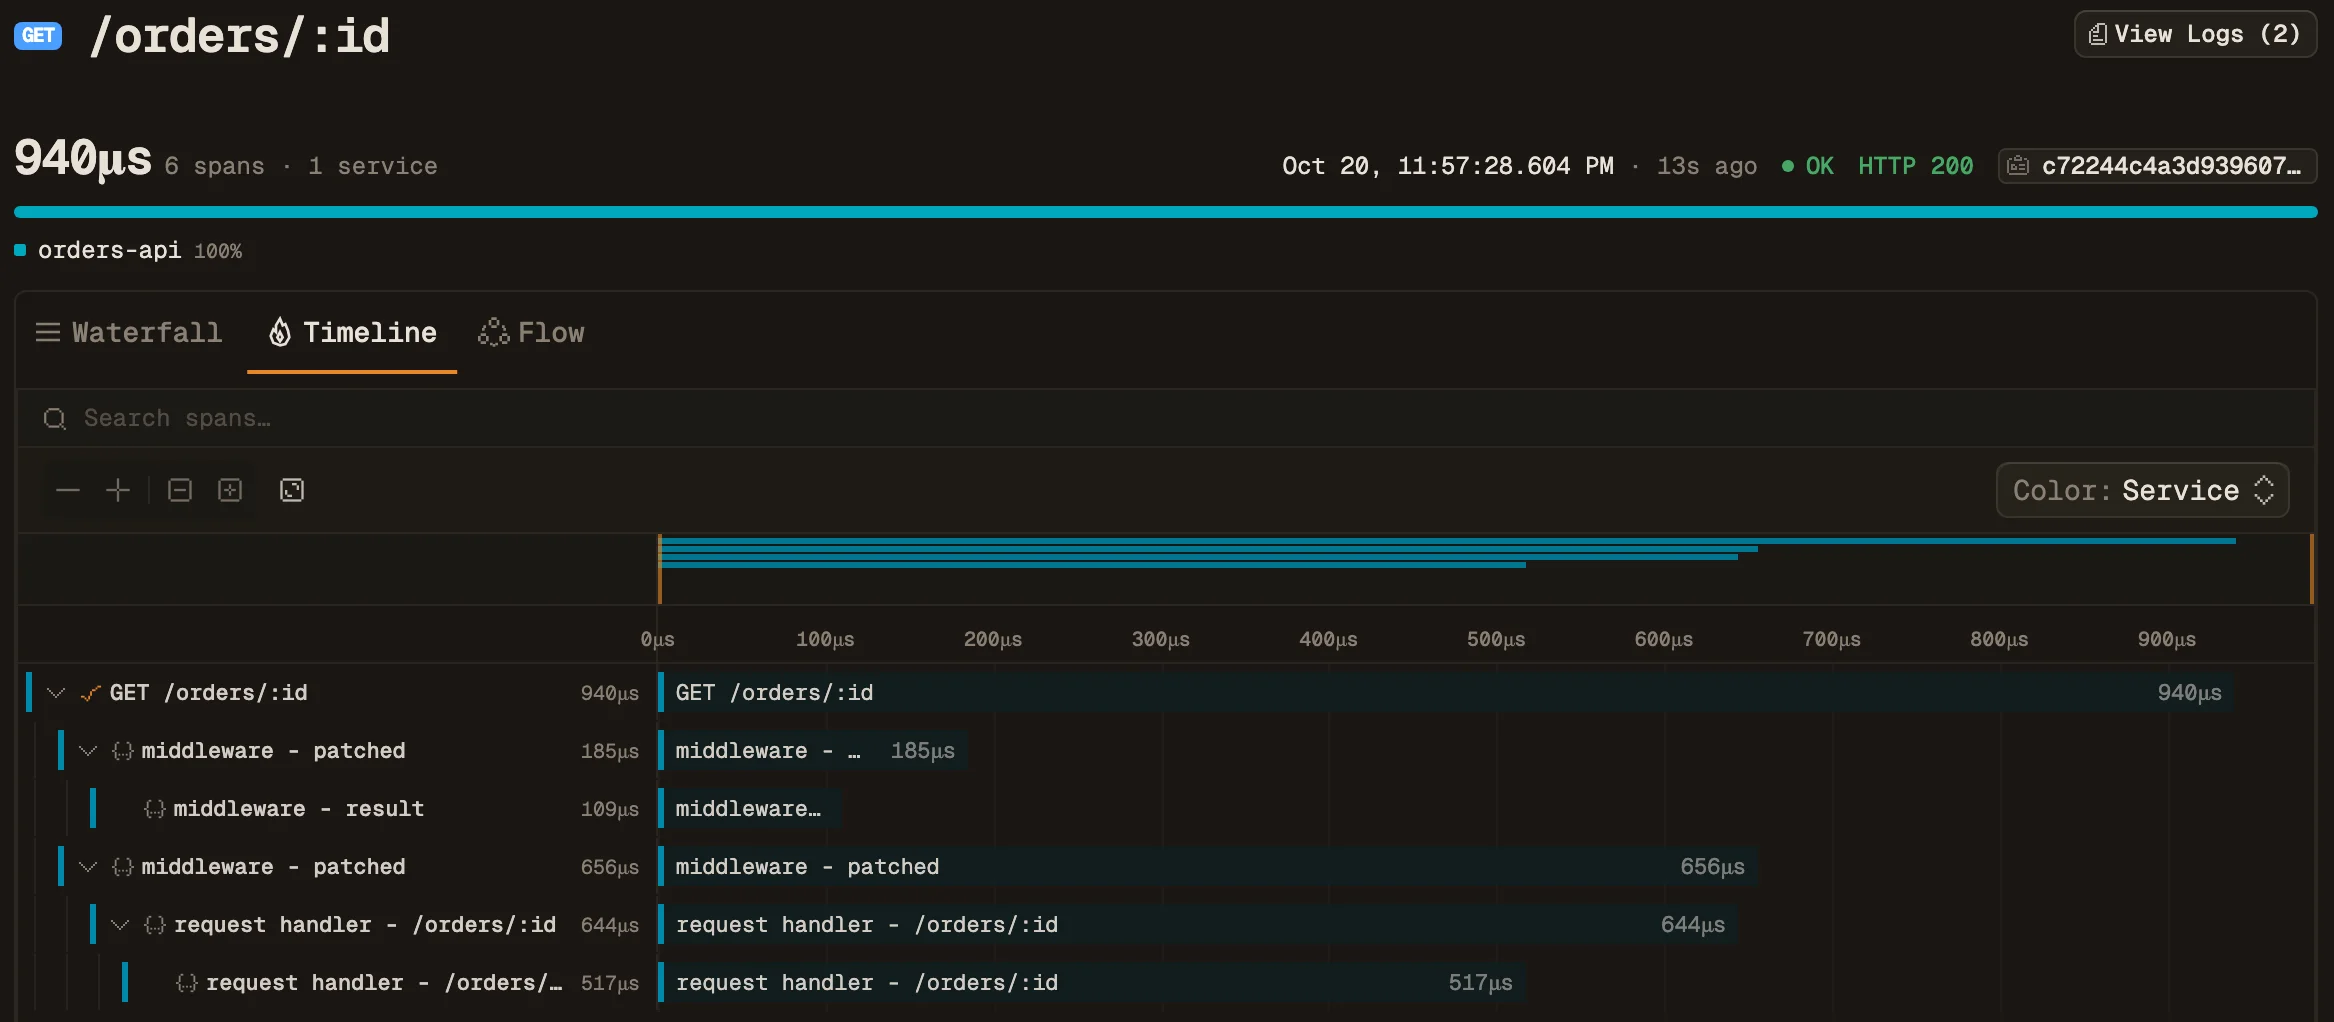
Set it up in Maple
Send your Node.js telemetry
The SDK setup, environment variables and troubleshooting are in the docs.
06 · Comparison
Pino vs Winston
Winston is the other widely used Node.js logger. Both are MIT-licensed and both work with OpenTelemetry. They differ mostly in where formatting and shipping happen.
| Pino | Winston | |
|---|---|---|
| Default output | One JSON object per line | Whatever format builds; JSON is one option |
| Levels | trace 10 up to fatal 60 | npm levels: error 0 down to silly 6 |
| Formatting | Outside the process: pino-pretty or your log tooling | In the process with format.combine() |
| Transports | Worker threads via pino.transport() | Streams on the main thread (Console, File, Http) |
| Redaction | Built-in redact option | A custom format |
| OpenTelemetry | Instrumentation adds trace IDs and sends records | Instrumentation adds trace IDs; sending needs @opentelemetry/winston-transport |
In Pino's own benchmark, a run of logger.info('hello world') calls averaged 114.8 ms with Pino and 270.2 ms with Winston.
Choose Pino when logs are JSON headed for a collector and per-call cost matters. Choose Winston when the process itself must write several formats to several destinations, or an existing codebase depends on its format pipeline. Moving between them is mostly mechanical: both take a metadata object and a message, and Pino puts the object first.
Sources and further reading