01 · Definition
API latency is only useful after you define the clock
API latency is the elapsed time for an API operation from a stated observation point. Client timing includes network setup and transfer; server timing covers only the work visible after the server receives the request.
Your checkout endpoint can have a 42 ms median and a 380 ms p99. Most requests are healthy, but the slowest 1% take a different path through the system. An average smooths that path out of view.
Before comparing numbers, write down which interval you mean. Several measurements are commonly called latency, and each exposes a different part of the request path.
| Measurement | Starts | Stops | Best vantage point |
|---|---|---|---|
| Connection setup | Before DNS | After TCP and TLS | Client |
| Time to first byte | Before the request | First response byte | Client |
| Server duration | Server receives request | Server completes handling | Server span or metric |
| Total response time | Before the request | Full response body | Client |
An HTTP server span cannot see the user's DNS lookup or the distance between the user and your edge. A client-side time-to-first-byte measurement includes those costs, but cannot explain which database query ran inside the server.
For the rest of this guide, latency means inbound request duration as observed by the server unless we explicitly say time to first byte or total response time. Server duration is the clock we can break into child spans and change from application code.
02 · Outside-in measurement
Measure one request from the client before opening a dashboard
When someone says “the API is slow,” curl is a good first instrument. Its --write-out variables expose cumulative timestamps for DNS, connection setup, TLS, first byte, and the completed transfer.
curl --output /dev/null --silent --show-error \
  --write-out 'dns:      %{time_namelookup}s\nconnect:  %{time_connect}s\ntls:      %{time_appconnect}s\nttfb:     %{time_starttransfer}s\ntotal:    %{time_total}s\n' \
  https://api.example.com/v1/checkout
Example output:
dns:      0.014s
connect:  0.048s
tls:      0.096s
ttfb:     0.381s
total:    0.389s
These values are cumulative, not individual stage durations:
- DNS took about 14 ms.
- TCP setup took about
48 - 14 = 34 ms. - TLS took about
96 - 48 = 48 ms. - The wait after connection setup and before the first byte took about
381 - 96 = 285 ms. - Transferring the response after the first byte took about
389 - 381 = 8 ms.
The long interval begins after the secure connection exists and ends when the response starts. That points toward server work or a downstream dependency, but it does not prove which one.
Run the probe from more than one relevant location. A laptop beside the server tells a different story from a mobile client across an ocean. Separate curl invocations also create separate connection histories, while a production client may reuse connections.
03 · Distribution
API latency percentiles expose the slow path
Production latency is a distribution, so read it as one.
The typical request is healthy. Even the first 95% are healthy. The problem lives in a much slower tail. That shape narrows the search: a general CPU shortage or consistently expensive code path usually moves the center of the distribution too. A p99-only regression suggests an intermittent branch such as a cache miss, lock contention, retries, a cold start, a saturated connection pool, or an input-specific query.
Percentiles need enough context to mean anything
- Compare the same route and environment. Blending
GET /healthwithPOST /checkoutproduces a number that describes neither. - Use a time window with enough requests. A p99 over 40 requests is effectively one observation.
- Compare request volume alongside latency. A pool that is fine at 30 requests per second may queue at 300.
- Record a route template such as
/orders/{orderId}, not raw paths such as/orders/847291.
There is no universal “good” p99. The target comes from the user journey and its service-level objective. A synchronous checkout and a background export should not share a threshold.
04 · Telemetry model
OpenTelemetry connects the percentile to request work
OpenTelemetry gives each request a trace and each timed operation inside it a span. Standard HTTP instrumentation records the request method, route, status, and duration. Instrumented database and HTTP clients add child spans, while context propagation connects work across service boundaries.
The stable HTTP conventions define http.server.request.duration as the server-side request-duration histogram. In a trace, an inbound HTTP request is a SERVER span and http.route is the low-cardinality route template. Those conventions let a backend group the same operation across runtimes and releases.
At minimum, make these resource attributes trustworthy:
service.name=order-service
deployment.environment.name=production
service.version=def456
service.name gives the request an owner. The environment separates production from staging. service.version turns “latency started around 14:05” into a comparison between the code before and after a release.
Metrics and traces answer different parts of the investigation. A histogram summarizes the population and should drive the alert. A trace preserves the order and duration of work inside one request. Deriving metrics from spans can connect the two, but a sampled set of traces is not automatically a statistically safe latency dataset.
05 · Investigation strategy
Opening the slowest trace first can waste the investigation
Sorting every trace by duration and opening the worst one feels efficient. It can send a team after a rare cold start while the actual regression is a release-specific database loop.
Preserve the incident window first. Compare the affected route with its own baseline, group it by service.version, region, or instance, and only then choose slow traces from the group that moved. The few minutes spent scoping the population prevent an interesting outlier from becoming the diagnosis.
| Observed shape | Likely direction | Evidence to inspect |
|---|---|---|
| p50, p95, and p99 rise | Common work or broad saturation | Root children, CPU, queues, dependencies |
| p99 rises; p50 stays flat | Intermittent branch or contention | Slow traces grouped by version and attributes |
| Latency rises with traffic | A finite pool is saturating | Pool wait, worker queue, database connections |
| Server is fast; TTFB is slow | Network, proxy, TLS, or edge path | Client timing by region and gateway spans |
| TTFB is fast; total is slow | Large or streamed response | Response size, compression, throughput |
| Span count grows after release | N+1 or retry amplification | Repeated operations and statements |
Make the smallest change supported by the evidence
- Batch repeated reads instead of adding a cache in front of an N+1 loop.
- Index the predicate proven slow by the query plan, not every nearby column.
- Tune a connection pool only after measuring acquisition wait and database capacity together.
- Put timeouts and bounded retries around downstream calls. Retries without a budget multiply tail latency.
- Move non-critical work out of the request path when the response does not depend on it.
If the trace does not expose the relevant boundary, add a span around that boundary before changing the system.
06 · Statistical limits
Sampling changes what your latency data can prove
At high volume, keeping every trace may be unnecessary. With consistent probability head sampling, retained traces can represent the broader population, although rare tail behavior remains sensitive to sample size.
Tail sampling is intentionally selective. A policy that keeps all slow or failed traces is useful for debugging, but the resulting trace set no longer represents normal traffic. Do not calculate an SLO percentile from a dataset deliberately biased toward slow requests.
For exact request-rate and latency metrics alongside sampled traces, derive metrics before traces are dropped. The OpenTelemetry Collector's Span Metrics connector can turn completed spans into request metrics and then pass the trace pipeline to a sampler. Keep metrics for alerting and long-range percentiles; keep representative or diagnostically valuable traces for explanation.
07 · Worked investigation
A p99 API latency regression, debugged in Maple
This representative investigation uses illustrative values. The service-level objective for POST /checkout says p99 must remain at or below 200 ms. An alert reports 380 ms.
Run it locally
Point an existing OpenTelemetry service at Maple
maple start --offline

export OTEL_EXPORTER_OTLP_ENDPOINT="http://127.0.0.1:4318"
export OTEL_EXPORTER_OTLP_PROTOCOL="http/protobuf"
export OTEL_SERVICE_NAME="order-service"
Local mode needs no API key. Hosted Maple uses https://ingest.maple.dev with an Authorization=Bearer ... OTLP header. The language guides cover automatic instrumentation and custom spans.
- 01
Check which percentile moved
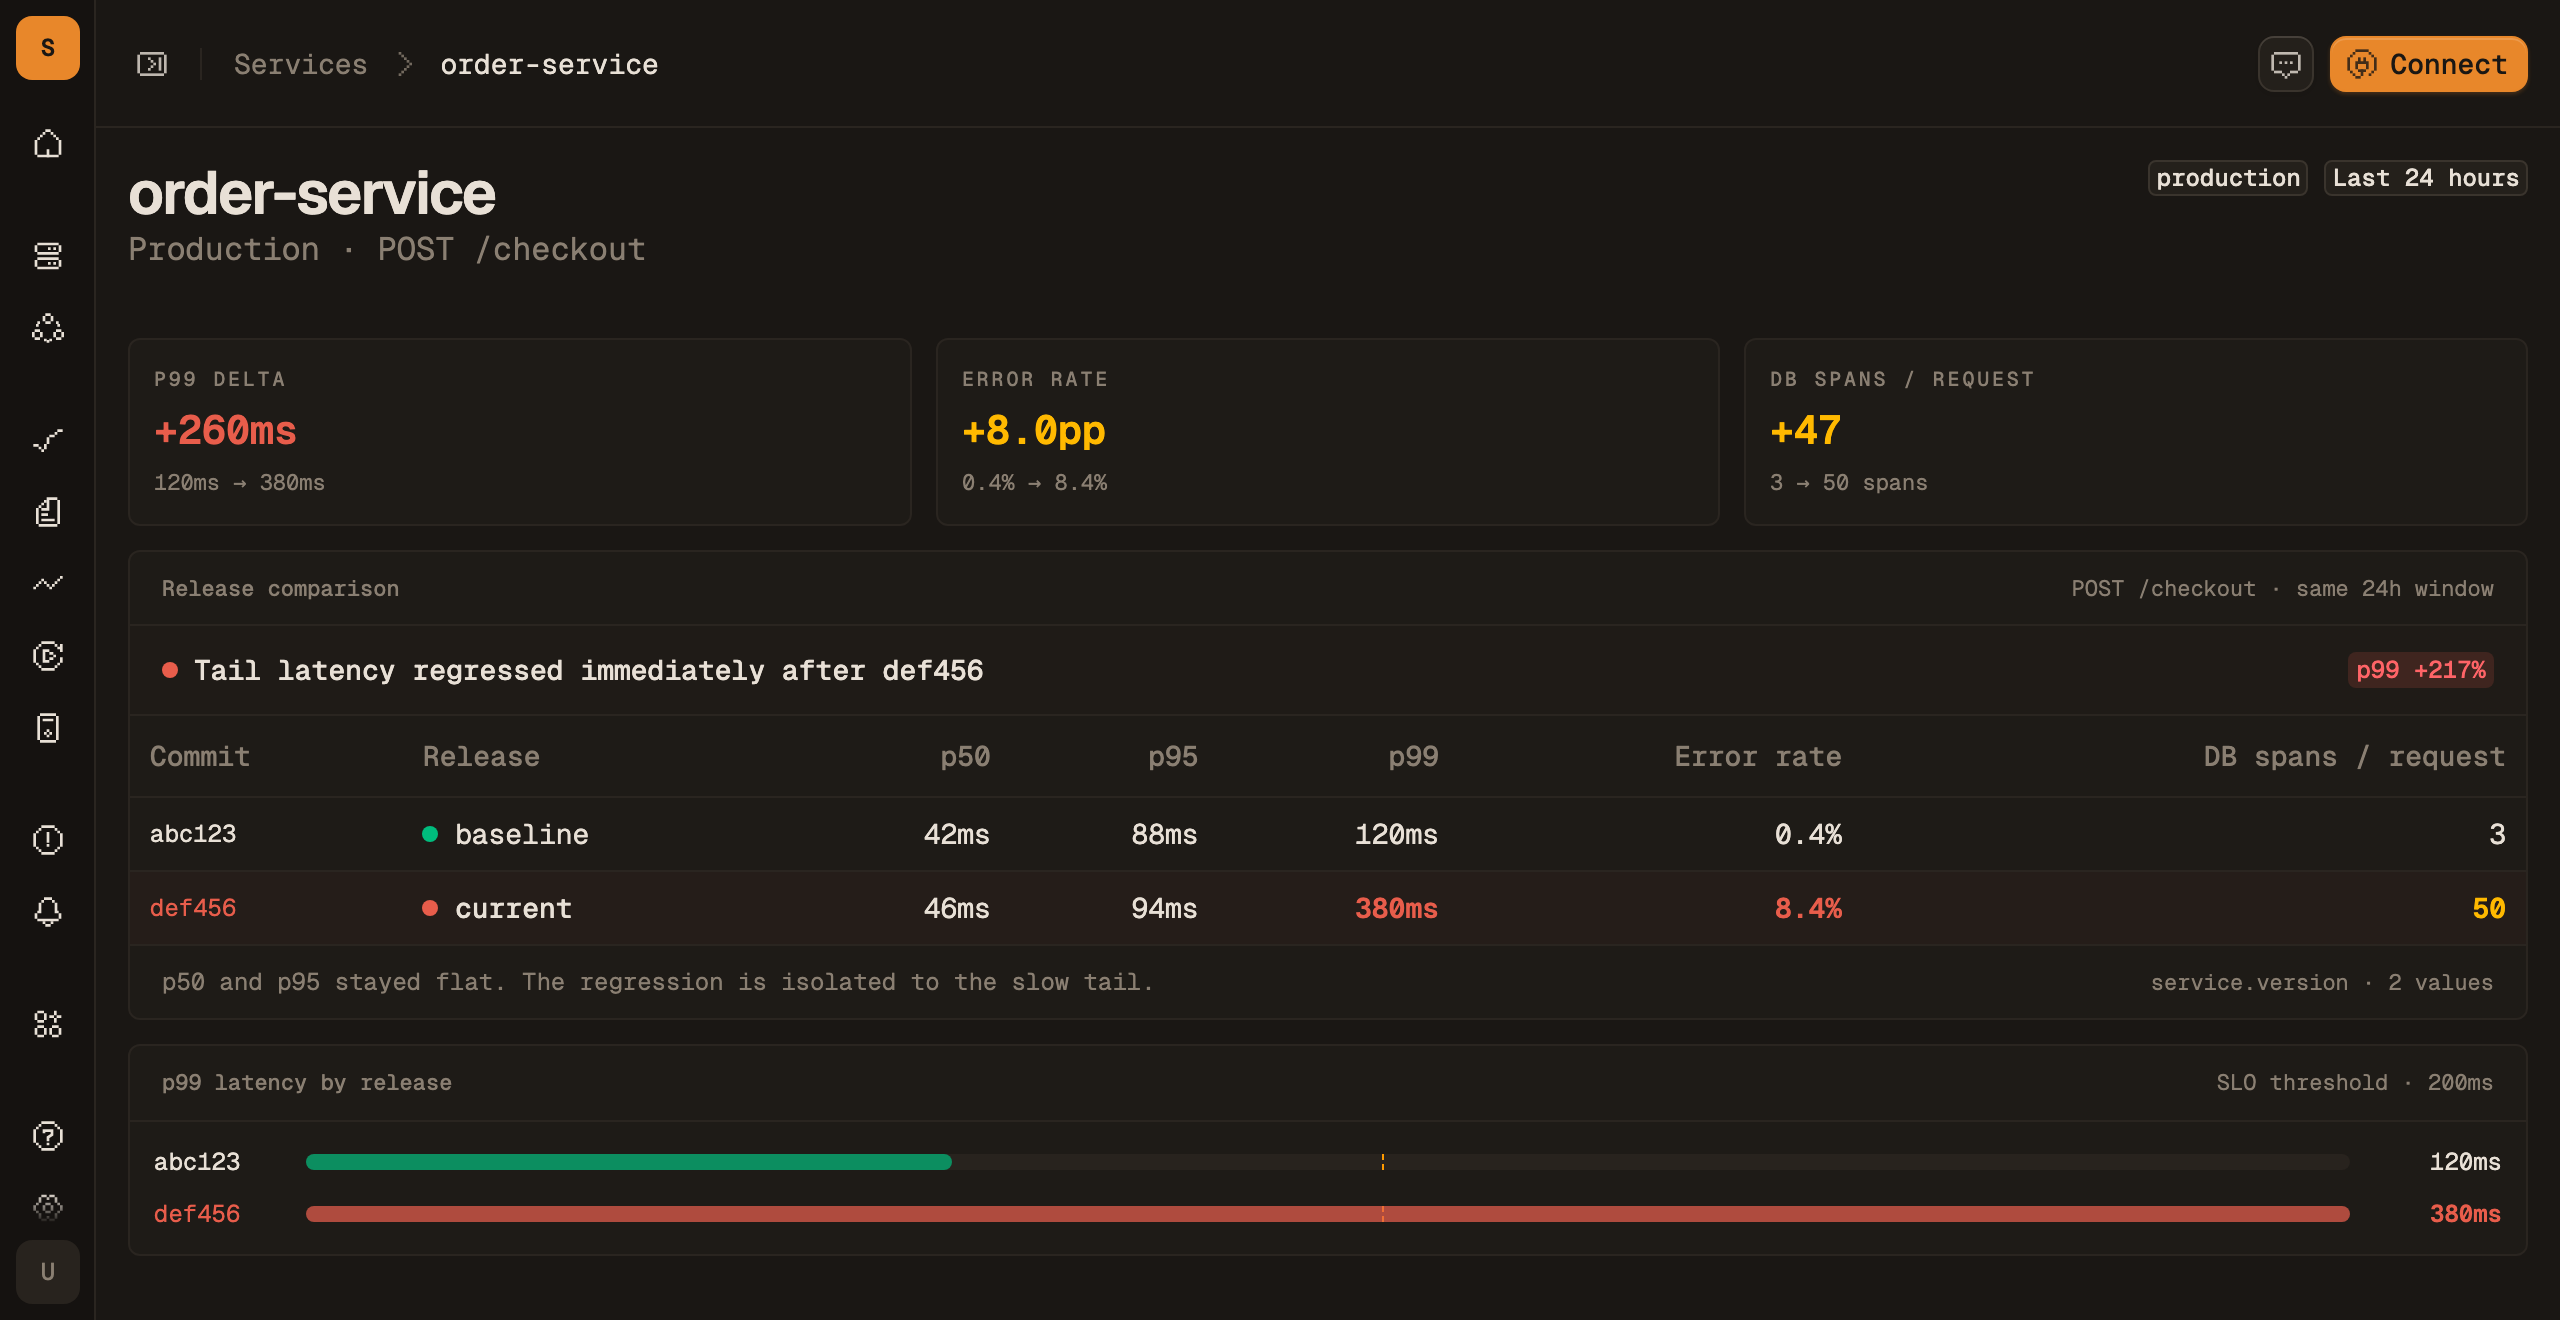
p50 and p95 stay nearly flat while p99 rises sharply. Request volume is steady. The evidence points to a conditional path affecting a small slice of checkout traffic.
- 02
Compare the releases before and after the regression
Grouping
POST /checkoutbyservice.versioncreates a clean boundary.abc123 · baseline120 msp99 · 3 DB spansdef456 · regressed380 msp99 · 50 DB spans
- 03
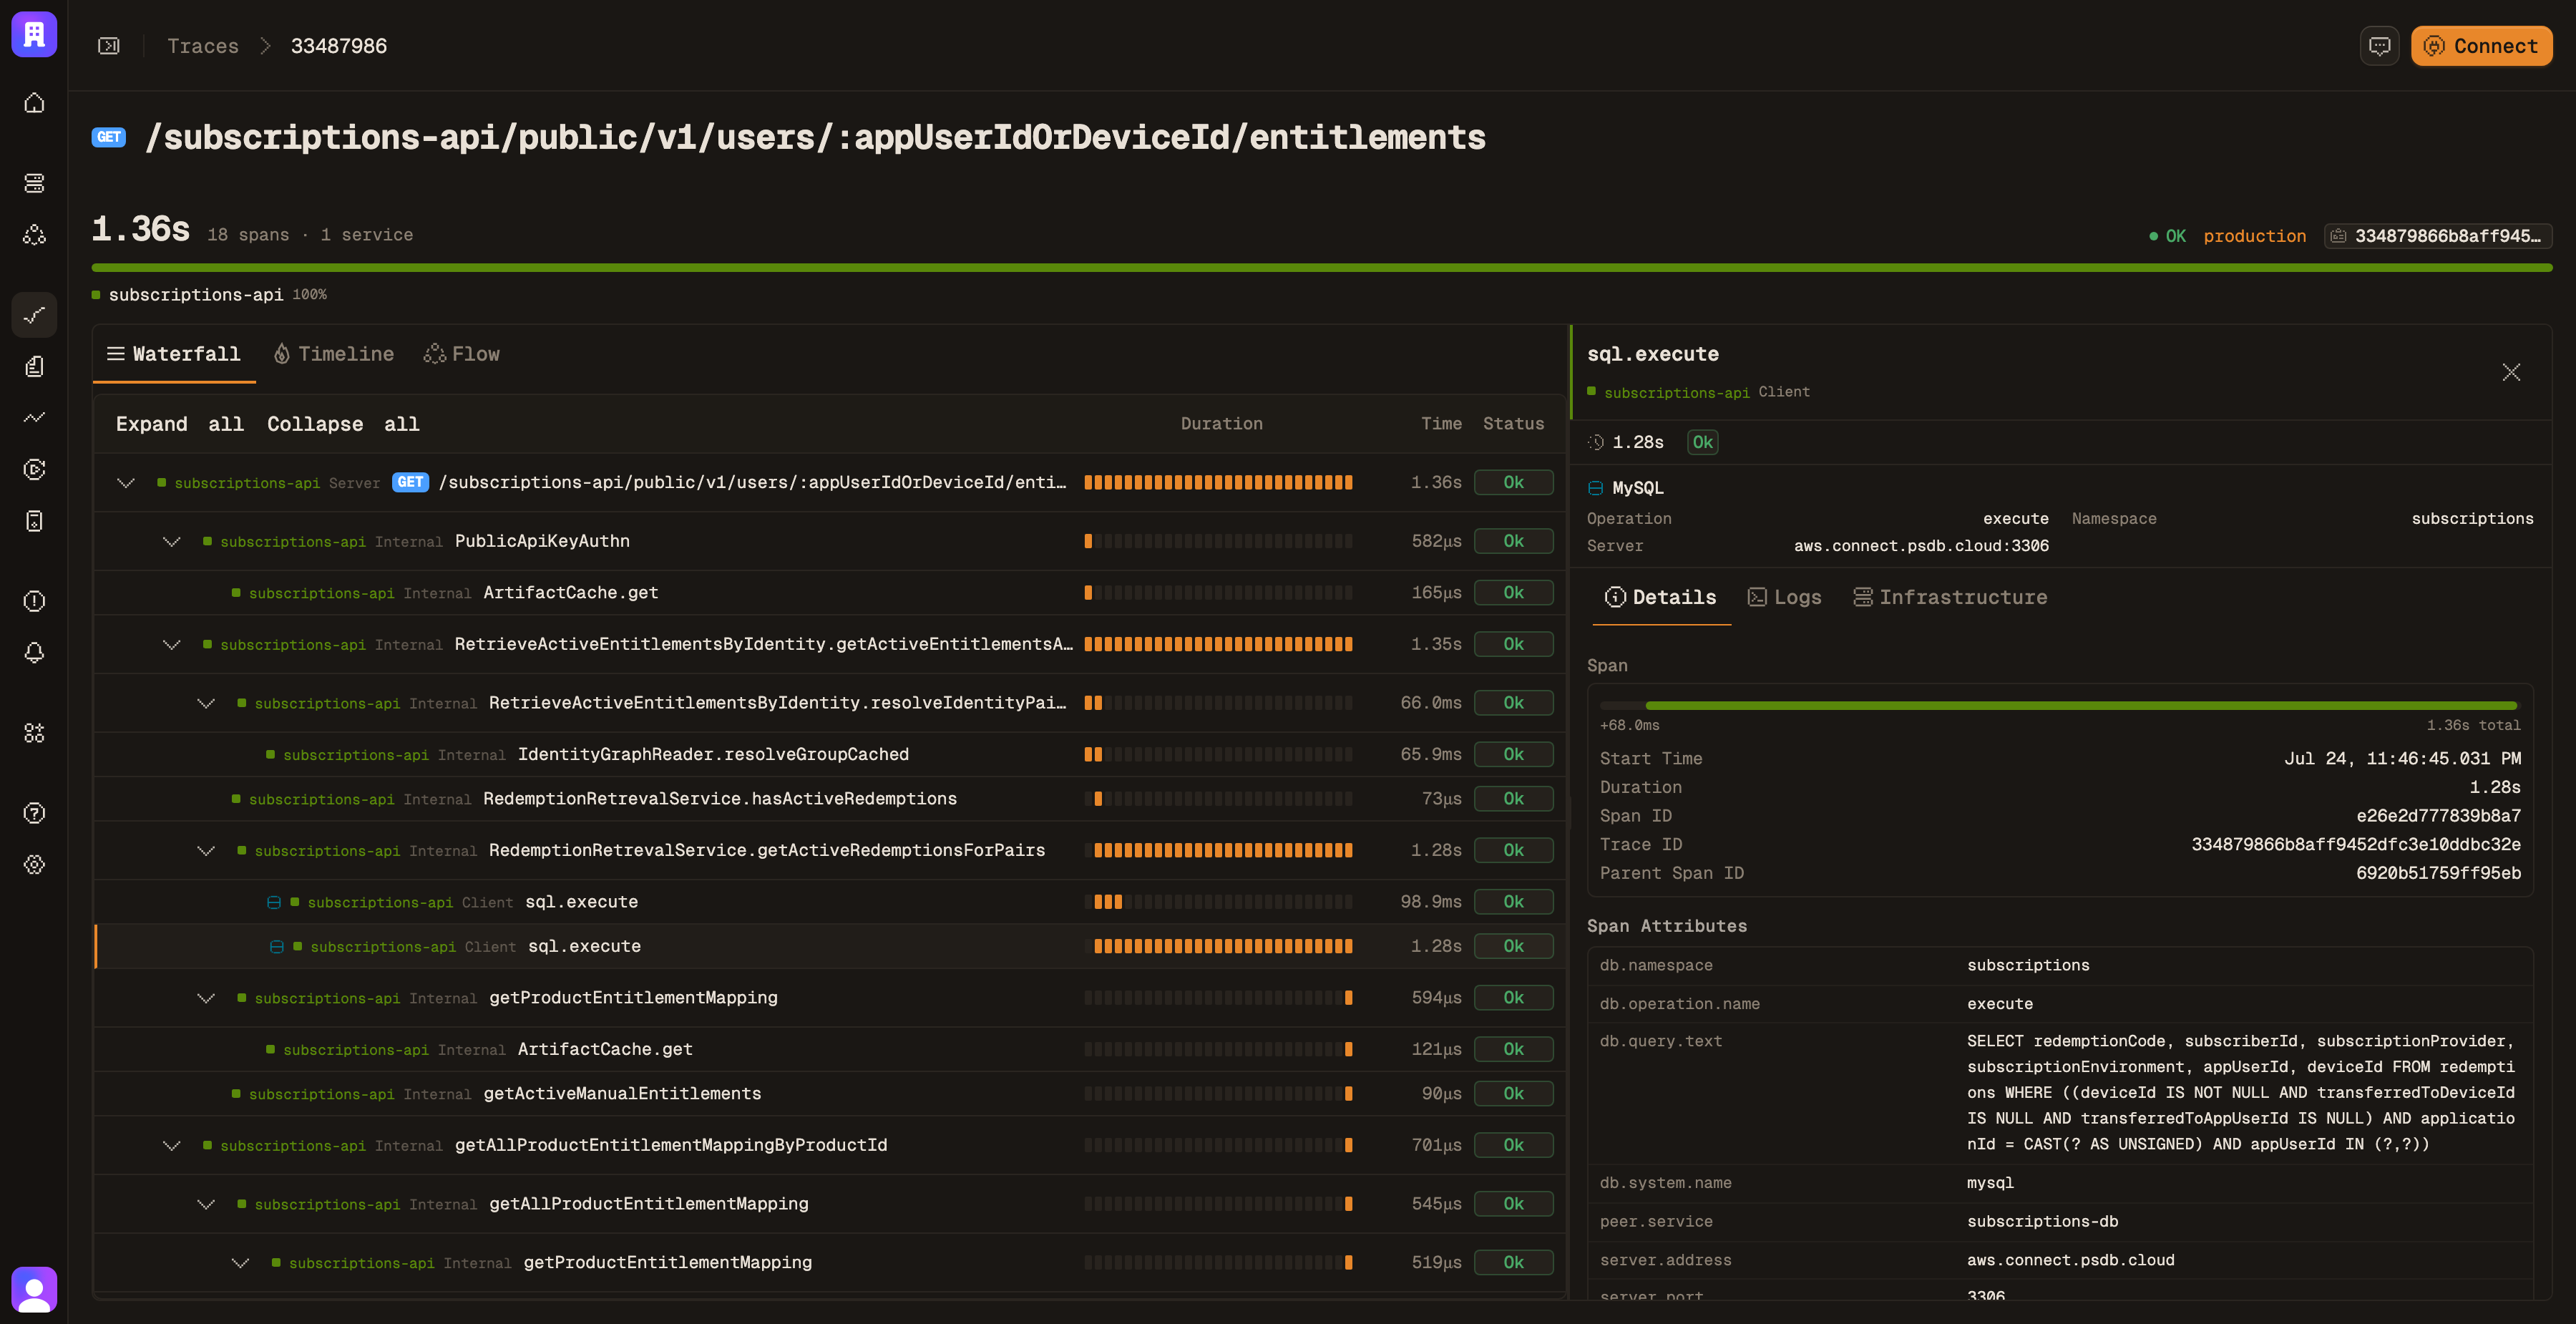
Open traces from the affected slice
service.name = "order-service"
deployment.environment.name = "production"
service.version = "def456"
http.route = "/checkout"
duration > 200ms
The waterfall shows repeated database child spans. Sequential repetition indicates an N+1 pattern; long waits before otherwise fast queries point to connection-pool or database concurrency limits.
- 04
Fix the mechanism and verify the same distribution
Assume
def456introduced a lookup inside an item loop. Revert for immediate safety, then replace the loop with a batched query or join. Verify p99 falls below 200 ms, database spans return from 50 to 3, and the other routes remain stable.
Keep the investigation anchored
Record the route, window, release, and target percentile
Write down those four values before opening a trace. That small record keeps the first unusual span from pulling the investigation away from the population that actually triggered the alert.
Sources and further reading