Alerting

Alerts that show their work

Every rule can be replayed against your history before it exists, and every evaluation is recorded after. When a page arrives you can see exactly why — and when one doesn't, you can see that too.

The surface

Previewed before it can page you

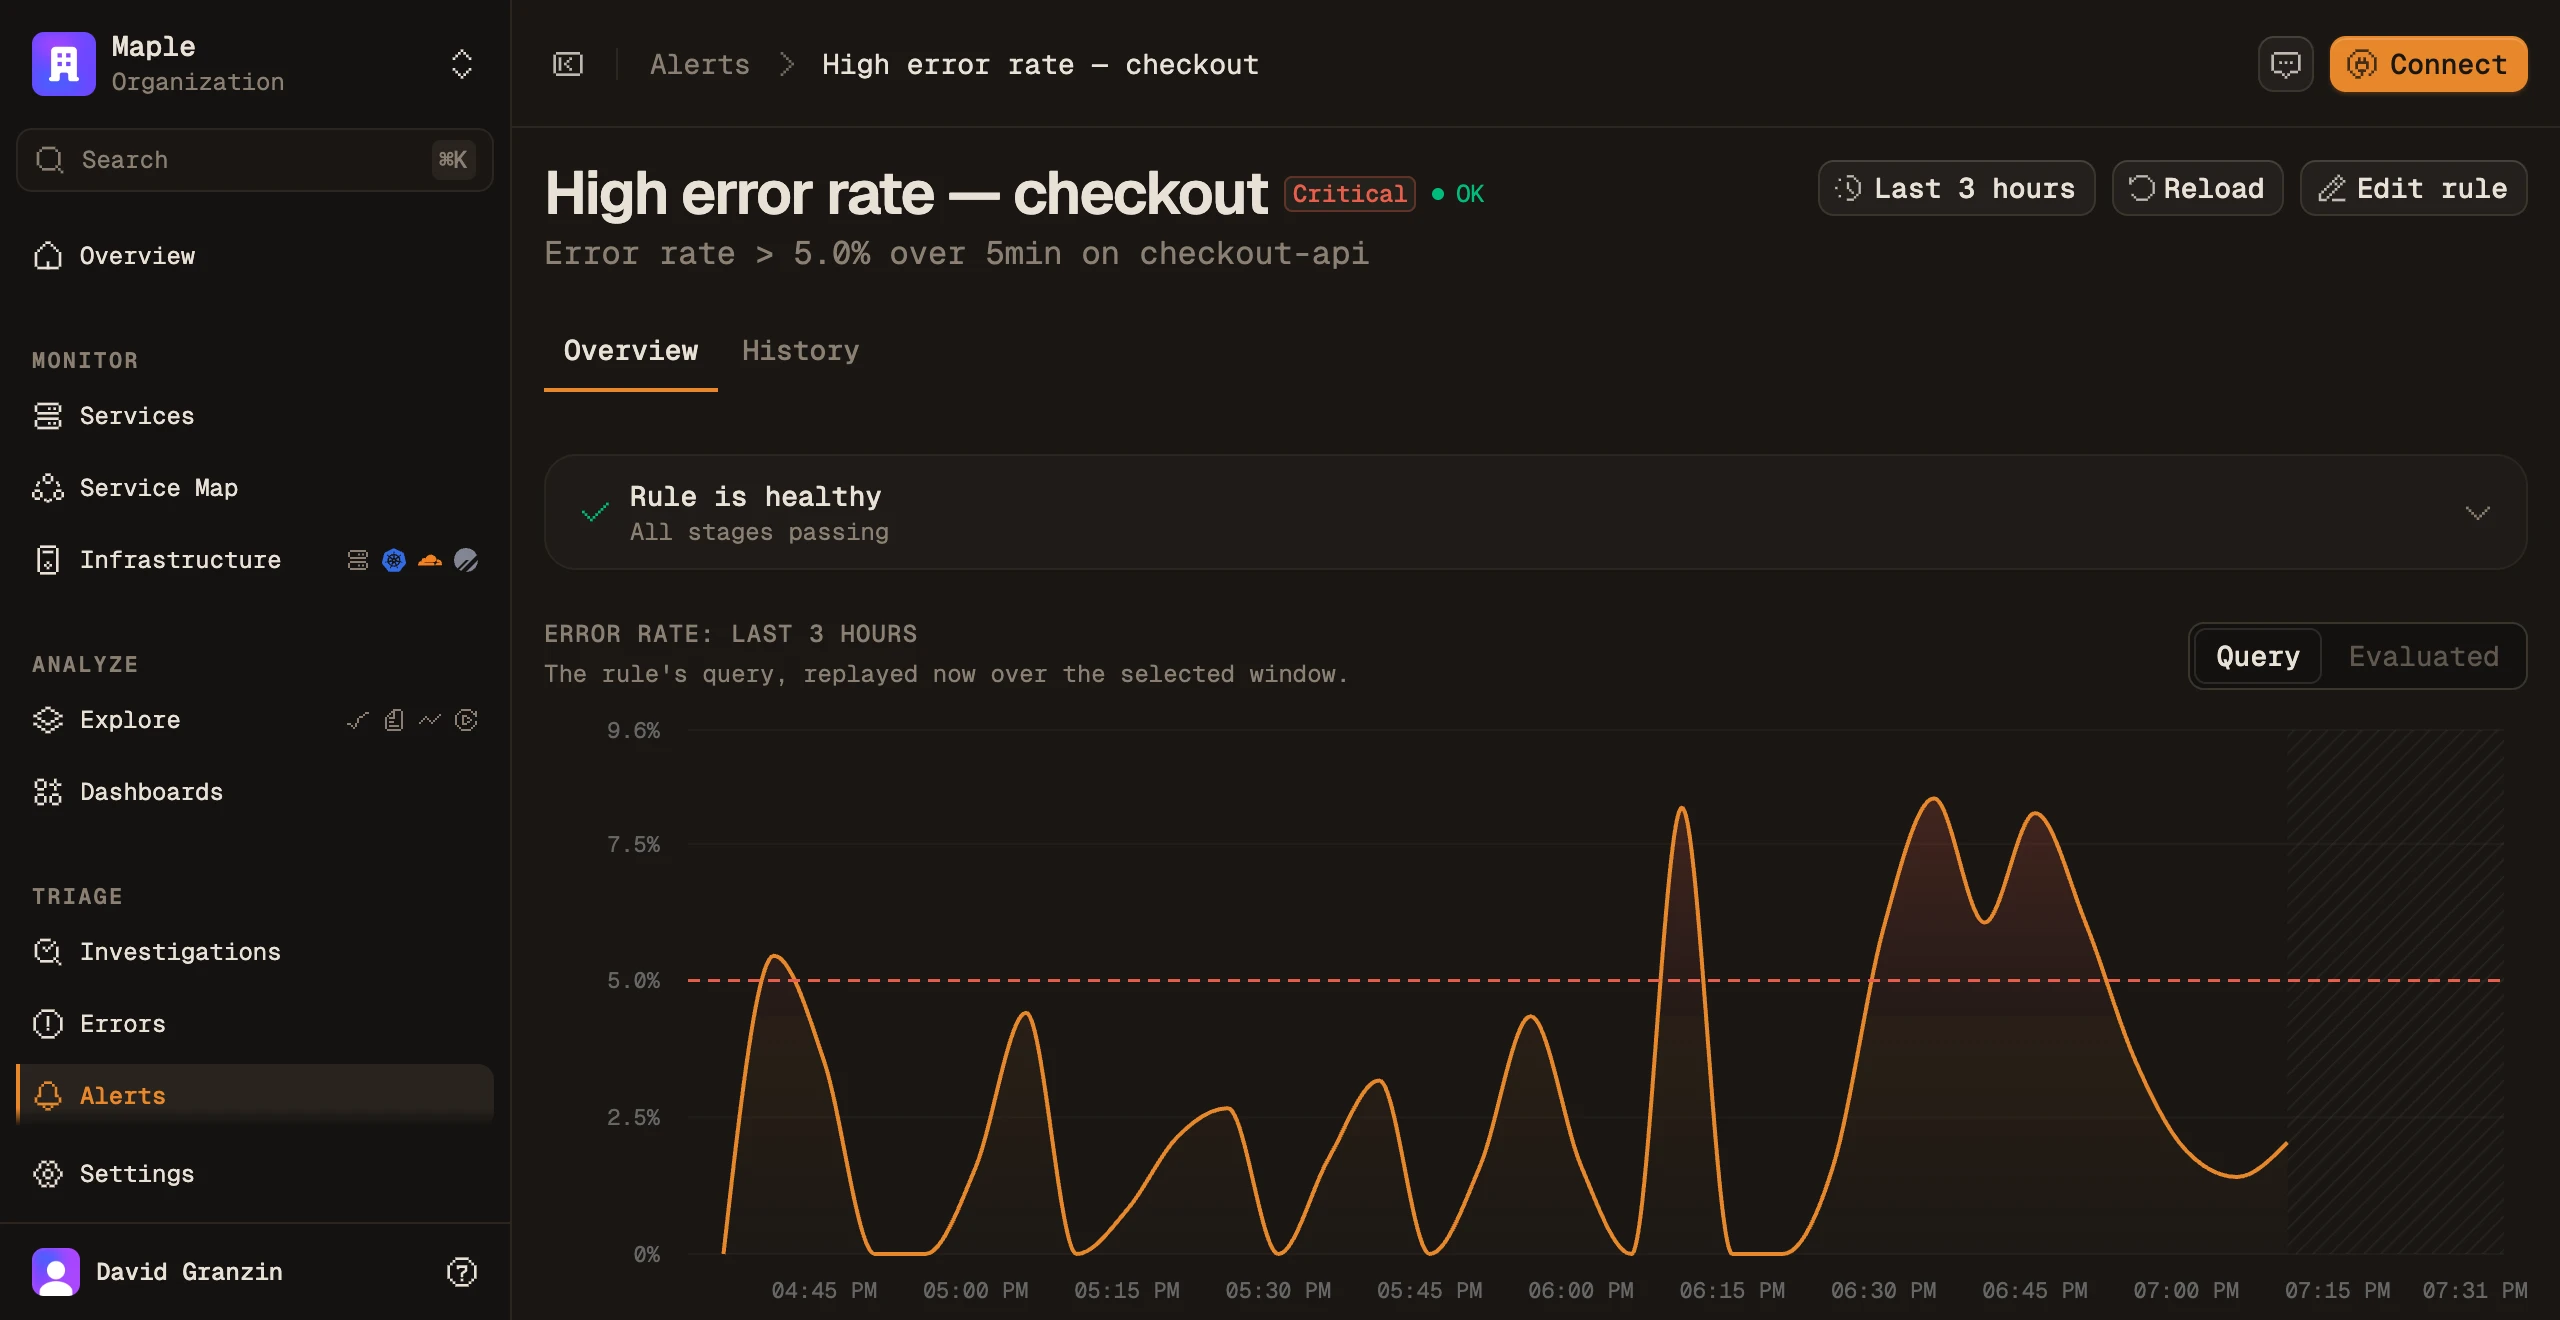
The preview runs the same code the scheduler runs, over the range you pick — per-window verdicts, would-fire spans and all. What the chart shows is what would have happened.

An error-rate rule's detail page: the evaluator-produced preview chart crossing the 5% threshold, with the rule reported healthy
/alerts rule high-error-rate · critical
signals
error_rate · p95 · p99 · apdex · throughput
sources
traces · logs · metrics · SQL
evaluates
every 60s
fires.after
N consecutive breaches
group.by
service.name · attr.*
routes.to
slack · pagerduty · discord · email · webhook

In motion

From breach to page in a minute

Rules evaluate every 60 seconds. Two consecutive breaches open the incident and send the notification with the observed value attached; two healthy windows resolve it without anyone clicking close.

alerts · rule high-error-rate LIVE
rule critical
signalerror_rate
conditionerror_rate > 5%
window5 min · 2 consecutive
group byservice.name
5%
OK FIRING breaches 0/2 1/2 2/2 · eval every 60s
#alerts via slack
M
Maple APP 14:32
High error rate — checkout
error_rate at 8.4% · threshold 5% · window 5 min
service checkout · env production · severity critical
View in Maple Chat
delivered · 200 · attempt 1/5
slackdiscordpagerdutyemailwebhookhazel
evaluated every 60s · auto-resolve after 2 healthy

What it does

From threshold to resolution

builder_query
Alert on anything
Seven built-in trace signals — error rate, P95/P99 latency, Apdex, throughput — plus any query-builder draft over traces, logs or metrics. Raw SQL when the builder can't say it.
preview
Evaluator-faithful preview
The preview replays the rule over history with the exact code the scheduler runs every minute. If it says the rule would have fired twice last Tuesday, that is what would have happened.
group by
One rule, per-group incidents
Group by service.name or any attribute and each group gets its own breach count, its own incident and its own history. A spike in one service never hides behind the average of twelve.
alert_checks
Every check on the record
Each evaluation writes its observed value, sample count and verdict — including failed queries, so a gap is visible instead of silent. When a rule stays quiet, a diagnosis panel walks the pipeline stage by stage.
renotify 30m
Delivery that survives
Queued dispatch with five attempts and backoff, every provider response stored, custom templates per destination, and a renotify interval while the incident stays open. Slack, PagerDuty, Discord, email, webhooks, Hazel.

Keep going

Surfaces that share this data

Point OTLP at Maple.

One endpoint, one key. Traces, logs, metrics and sessions land on the same trace id from the first request.