
Incident response is the process a team follows from the moment a production problem is detected until service is restored and the cause is fixed. It runs as a cycle, so what you learn from each incident makes the next one less likely or shorter.
This guide is written for small teams with one or two engineers on call. It covers how to prepare, the response steps, a worked incident timeline with the metrics that measure it, and how to run a postmortem.
Key takeaways
- Prepare in an afternoon: alerts on symptoms users feel, who gets alerted when, and runbooks for your top three failure modes.
- Stop the user impact before you know the cause; a deploy in the last hour is the first suspect, so roll it back.
- Declare early in one channel, such as #incidents, and post updates at a fixed interval while customers are affected.
- Write a blameless one-page postmortem for incidents customers noticed, with an owner and a due date on every action item.
- Once a quarter, count incidents per month, median time to detect and mitigate, and repeat causes.
01 · The process
How incident response works
An incident is an unplanned event that hurts users or puts data at risk: an outage, a slow checkout, a leaked credential. For the formal process, written for larger security teams, see NIST SP 800-61 and the SANS Incident Handler's Handbook.
The process has four phases. You Prepare on a quiet day. When an alert fires, you Detect and triage, then Mitigate and resolve until users are no longer affected and the system is clean. Afterwards you Learn in a postmortem whose action items go back into preparation: a load test that would have caught the bug, an alert that fires two minutes sooner, a rollback that takes one command.
The four phases and what each one holds. Each arrow takes the color of the phase it leaves.
02 · Before
Prepare in an afternoon
A team of two can do all of this in one afternoon. Each step ends with something written down that the on-call engineer can open at 3 a.m.
- 01
Alert on symptoms users feel
For each journey your business depends on (signup, login, checkout, the public API), add one error-rate alert and one latency alert on the traces your services already send. Real traffic shows failures a scripted ping from outside never reaches (see uptime monitoring). For latency, an Apdex score gives one number per journey instead of a percentile per endpoint. Leave CPU and memory off the phone: they fire for problems users never see. Check each rule against the data from your last outage to confirm it would have fired.
OutputFour to eight alert rules that reach a phone, each tested against a past outage.
- 02
Agree who gets alerted when
Decide whose phone the alerts ring, by day, at night and on weekends, so that at any hour at least one person who can deploy is reachable. Send a test alert to each phone. Pick one channel, such as #incidents, where whoever handles an incident posts what they see.
OutputA short note with names and hours, a test alert each person received, and the channel.
- 03
Write runbooks for your top three failure modes
List the three things most likely to break. For most small teams that is a bad deploy, the database and a third-party API. Write one page each: how it shows up, where to look, and the first mitigation to try. The bad-deploy runbook holds the exact rollback command, run once by everyone who gets alerted.
Writing them also hardens the system before anything breaks. A runbook that says "restore from the last backup" makes you check that the backup restores, and a third-party API with no timeout or fallback shows up while you describe how it fails.
OutputThree one-page runbooks linked from their alerts, and a list of the weak spots you found.
03 · During
Respond: the incident response steps
When an alert fires, whoever is on call works through these steps in order, often alone. Communication starts with the first post in #incidents and runs alongside the rest until the final update.
- 01
Detect
Detect and triageAn alert fires on something users feel: error rate, latency, a drop in traffic. A customer report counts too, and an incident customers reported first should end with a new alert among the postmortem's action items.
- 02
Triage and declare
Detect and triageAcknowledge the page and check how far the problem reaches: one service or all, one region or all, which customers. If it matches your incident definition, post in #incidents with what you see and that you are on it. That post is the declaration. Declaring early and downgrading later costs less than declaring late.
- 03
Mitigate
Mitigate and resolveStop the user impact before you know the cause. Roll back the last deploy, turn off the feature flag, fail over to another region, scale up or shed load. A deploy in the last hour is the first suspect.
- 04
Communicate
ThroughoutPost a short update at a fixed interval while customers are affected, even when nothing has changed: what is broken, what you are doing, when the next update comes. If a second engineer is around, hand them the updates and keep debugging.
- 05
Resolve
Mitigate and resolveConfirm recovery on the same signal that detected the problem, then check for side effects: queued jobs, duplicate writes, retries still running. Close the incident, post a final update and decide whether it needs a postmortem. The root-cause fix can ship later as an action item.
On a security incident the same steps apply with different mitigations: isolate the compromised host, rotate the leaked credential, then remove the attacker's access before you restore service.
04 · Worked example
An incident, minute by minute
A deploy at 14:02 UTC makes checkout run one database query per item in a cart. At normal traffic nobody notices. At the afternoon peak, large carts hold database connections longer, the connection pool runs dry, and checkout starts failing.
This is the ideal case, with every step on time and in order. Real incidents are more hectic: two things break at once, the first guess is wrong, nobody posts an update for 40 minutes. Skip what is not urgent in the moment and fill it in afterwards.
The timeline
-
Deploy
checkout v2.41.0 ships. It runs one database query per item when it loads a cart.
-
Impact starts
Large carts hold database connections longer, the connection pool runs dry and checkout requests fail with 503.
-
Alert fires
The checkout error rate has been above 5% on two checks in a row. The alert rule opens an incident and PagerDuty pages the on-call engineer.
-
Acknowledged
The on-call engineer acknowledges the page. The error rate is 23% on checkout and normal everywhere else.
-
Declared
The on-call engineer posts in #incidents and asks a second engineer to take the status page updates.
-
Diagnosis
Failing traces wait 4 to 5 seconds for a database connection before they time out. The failures started four minutes after the deploy.
-
Decision
Roll back to v2.40.3 instead of raising the pool size, following the bad-deploy runbook. The first status page update goes out.
-
Mitigated
The rollback finishes. The error rate is under 1% within two minutes.
-
Alert resolves
Once the 5-minute window no longer holds the failures, two healthy checks in a row resolve the alert's incident. The resolve notification closes the PagerDuty incident.
-
Resolved
The order queue is drained and the payment provider confirms no duplicate charges. The on-call engineer closes the incident and books the postmortem.
The dot on each entry takes the color of its phase: Detect and triage until the decision to roll back, Mitigate and resolve from then on. The rollback went out before anyone had confirmed the cause, which is the intended order. The diff was read against the slow traces after the incident closed.
MTTD, MTTA, MTTM and MTTR
Each incident metric is a clock that starts and stops at a different event. They are worth tracking because each one shows where an incident's time went and which kind of fix would shorten it. A rough estimate written into the postmortem after each incident is enough to see the trend over a few months. Measured on this incident:
| Metric | Starts | Stops | Shortened by |
|---|---|---|---|
| MTTD | User impact begins | An alert fires or someone reports it | Alerts on user-facing symptoms, shorter evaluation windows |
| MTTA | The alert fires | A person acknowledges it | Alerts that ring a phone, fewer noisy alerts |
| MTTM | User impact begins | User impact ends | Rollbacks that take one command, feature flags, runbooks |
| MTTR | User impact begins | The incident is closed | All of the above, plus written exit criteria |
MTTR also stands for repair, recover and respond, so teams end up comparing different clocks. Write down which one yours means. With a handful of incidents a quarter, one long outage moves the mean a lot: report the median next to it.
05 · After
Learn: fewer and shorter incidents
After the incident closes, the remaining work is to change the system so the same failure is less likely, gets caught sooner or is over faster. The postmortem decides what those changes are.
The blameless postmortem
A blameless postmortem assumes everyone acted reasonably with what they knew at the time, and asks which parts of the system let a reasonable action cause an outage. "Checkout has no load test with large carts" leads to a fix. "Alex shipped a bad query" teaches people to hide their mistakes next time. Keep it to one page, written by whoever handled the incident while the details are fresh, and go through the action items with anyone who was involved. Write one for incidents customers noticed; skip it for the rest.
The template carries the checkout incident's numbers as an example. Copy it into your docs tool and fill each <placeholder> from the #incidents channel:
postmortem.md
# Postmortem: checkout failures after v2.41.0 (2026-10-19)

## What happened
Two or three sentences: what broke, for whom, for how long, how it was fixed.
User impact: 14:06 to 14:24 UTC, 23% of checkout attempts failed (<number> orders).

## Timeline (UTC)
Copied from the #incidents channel.

## Why it happened
The chain of events in the system. Describe systems and decisions, not people.

## What helped, what slowed us down
How we found out, and how long after impact started.

## Action items
| Action                                       | Type     | Owner  | Due    |
| -------------------------------------------- | -------- | ------ | ------ |
| Load test checkout with large carts          | Prevent  | <name> | <date> |
| Alert on connection pool wait time           | Detect   | <name> | <date> |
| Send checkout alerts to phones, not Slack    | Respond  | <name> | <date> |
| Put the rollback command in the runbook      | Mitigate | <name> | <date> |
Action items that change the system
Sort each action item by the number it moves. A postmortem with only prevent items leaves detection and mitigation as slow as they were; one with only detect items lets the same bug ship again.
| Type | Checkout example | What it moves |
|---|---|---|
| Prevent | Load test checkout with large carts | How often this failure happens |
| Detect | Alert on connection pool wait time | MTTD |
| Respond | Send checkout alerts to phones, not only to Slack | MTTA |
| Mitigate | Put the rollback command in the runbook | MTTM |
Track action items like feature work
Give each action item an owner, a due date and a ticket in the same tracker as feature work, and look at the open ones in your weekly planning.
Review the trend
Once a quarter, spend 30 minutes on the incident list and count:
- Incidents per month. A falling count is the sign that prevent items are working.
- Median MTTD and MTTM. These move when detect and mitigate items ship.
- Incidents a customer reported first. Each one points at a missing alert.
- Repeat causes. The same root cause twice means an action item from the first postmortem was not done, or did not work.
- Pages with no incident behind them. Tune or delete those alerts; every false page makes the next real one slower to acknowledge.
06 · In practice
Incident response in Maple
Detect Alert rules open incidents
- 01
Alert on what users feel
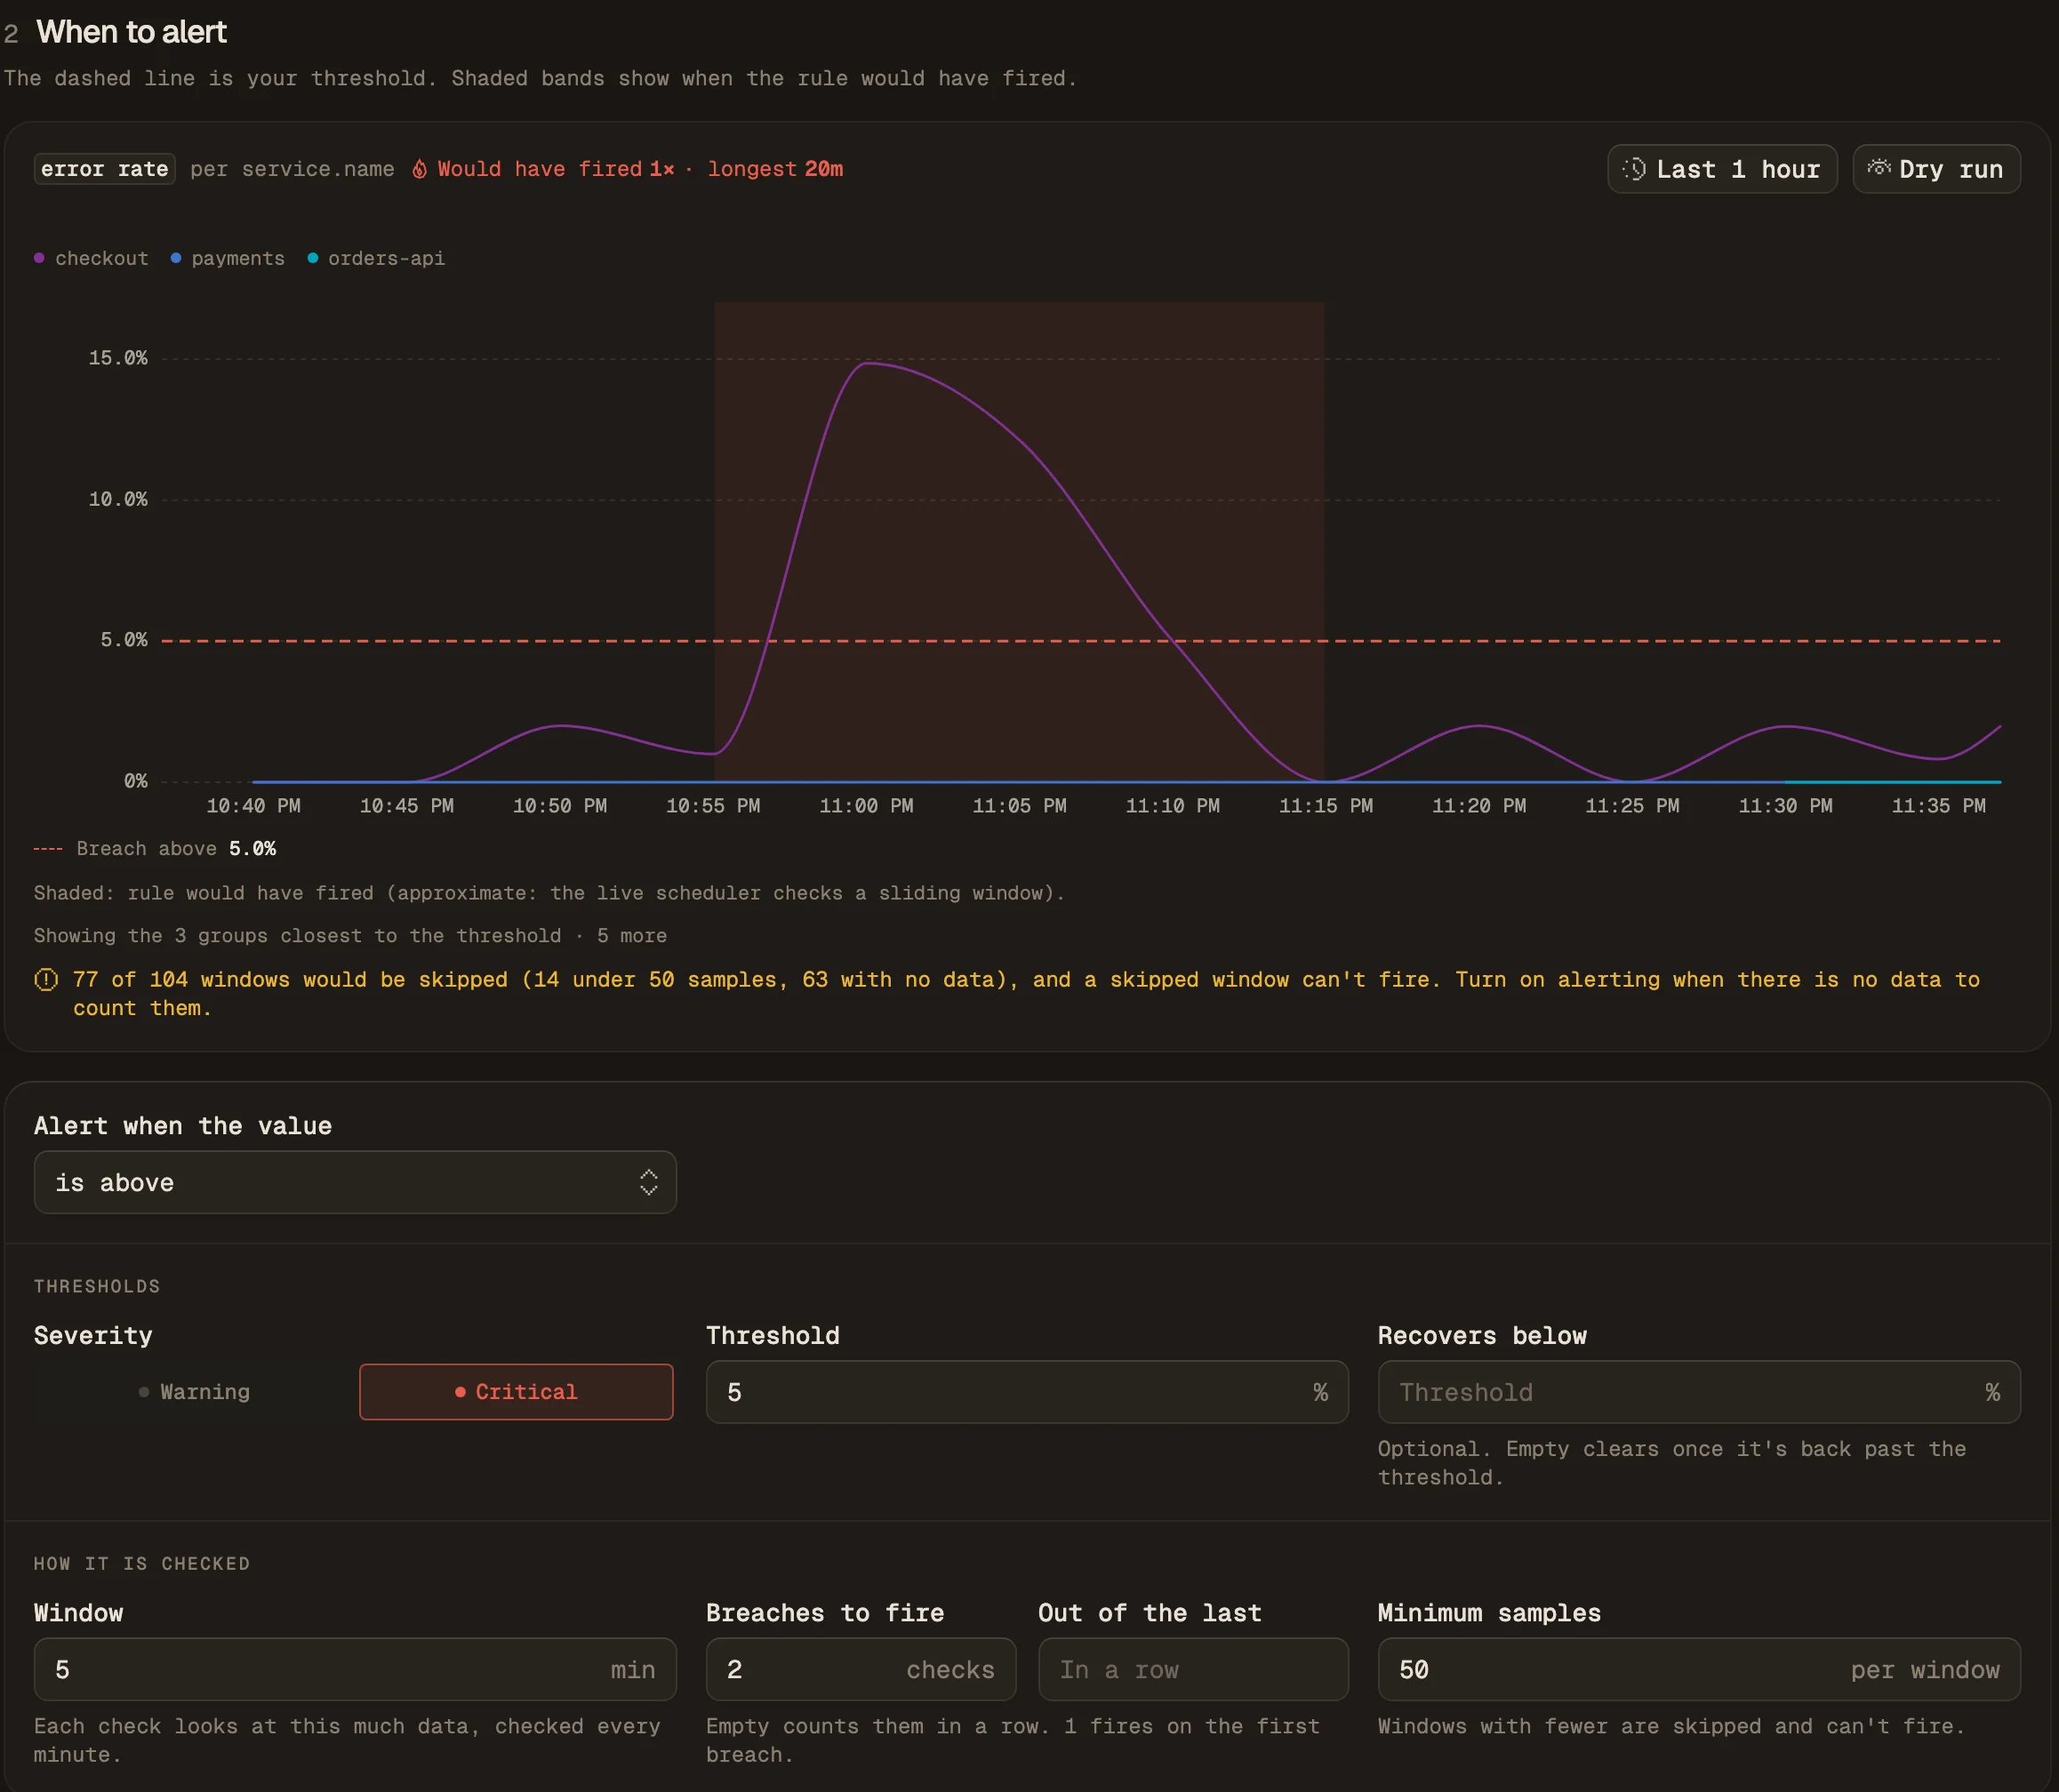
On the Alerts page, click New rule and start from a template such as High error rate (above 5% over a 5-minute window) or Slow P95 latency. Set Severity to Critical or Warning; Maple shows it on the incident and in every notification. Pick a past range and click Dry run to replay the rule: the chart shades where it would have held an incident open, so you can check it would have caught your last outage.
- 02
Route critical alerts to a phone
Each rule sends to the notification destinations attached to it. Attach PagerDuty to the Critical rules and a Slack channel to the Warning ones. PagerDuty receives a stable
dedup_key, so the trigger and the resolve land on the same PagerDuty incident. - 03
Open the incident from the notification
Maple checks each rule once a minute and opens an incident after Breaches to fire breaching checks in a row (2 by default). The notification shows the value, the threshold and the window, and links to the alert in Maple and to Maple AI. Open incidents are listed under Open on the Alerts inbox, with the current value against the threshold and how long each has been open. If the service stops sending telemetry, the incident shows Waiting on data and stays open instead of resolving on an empty window.

Triage and fix Errors, traces and the MCP server
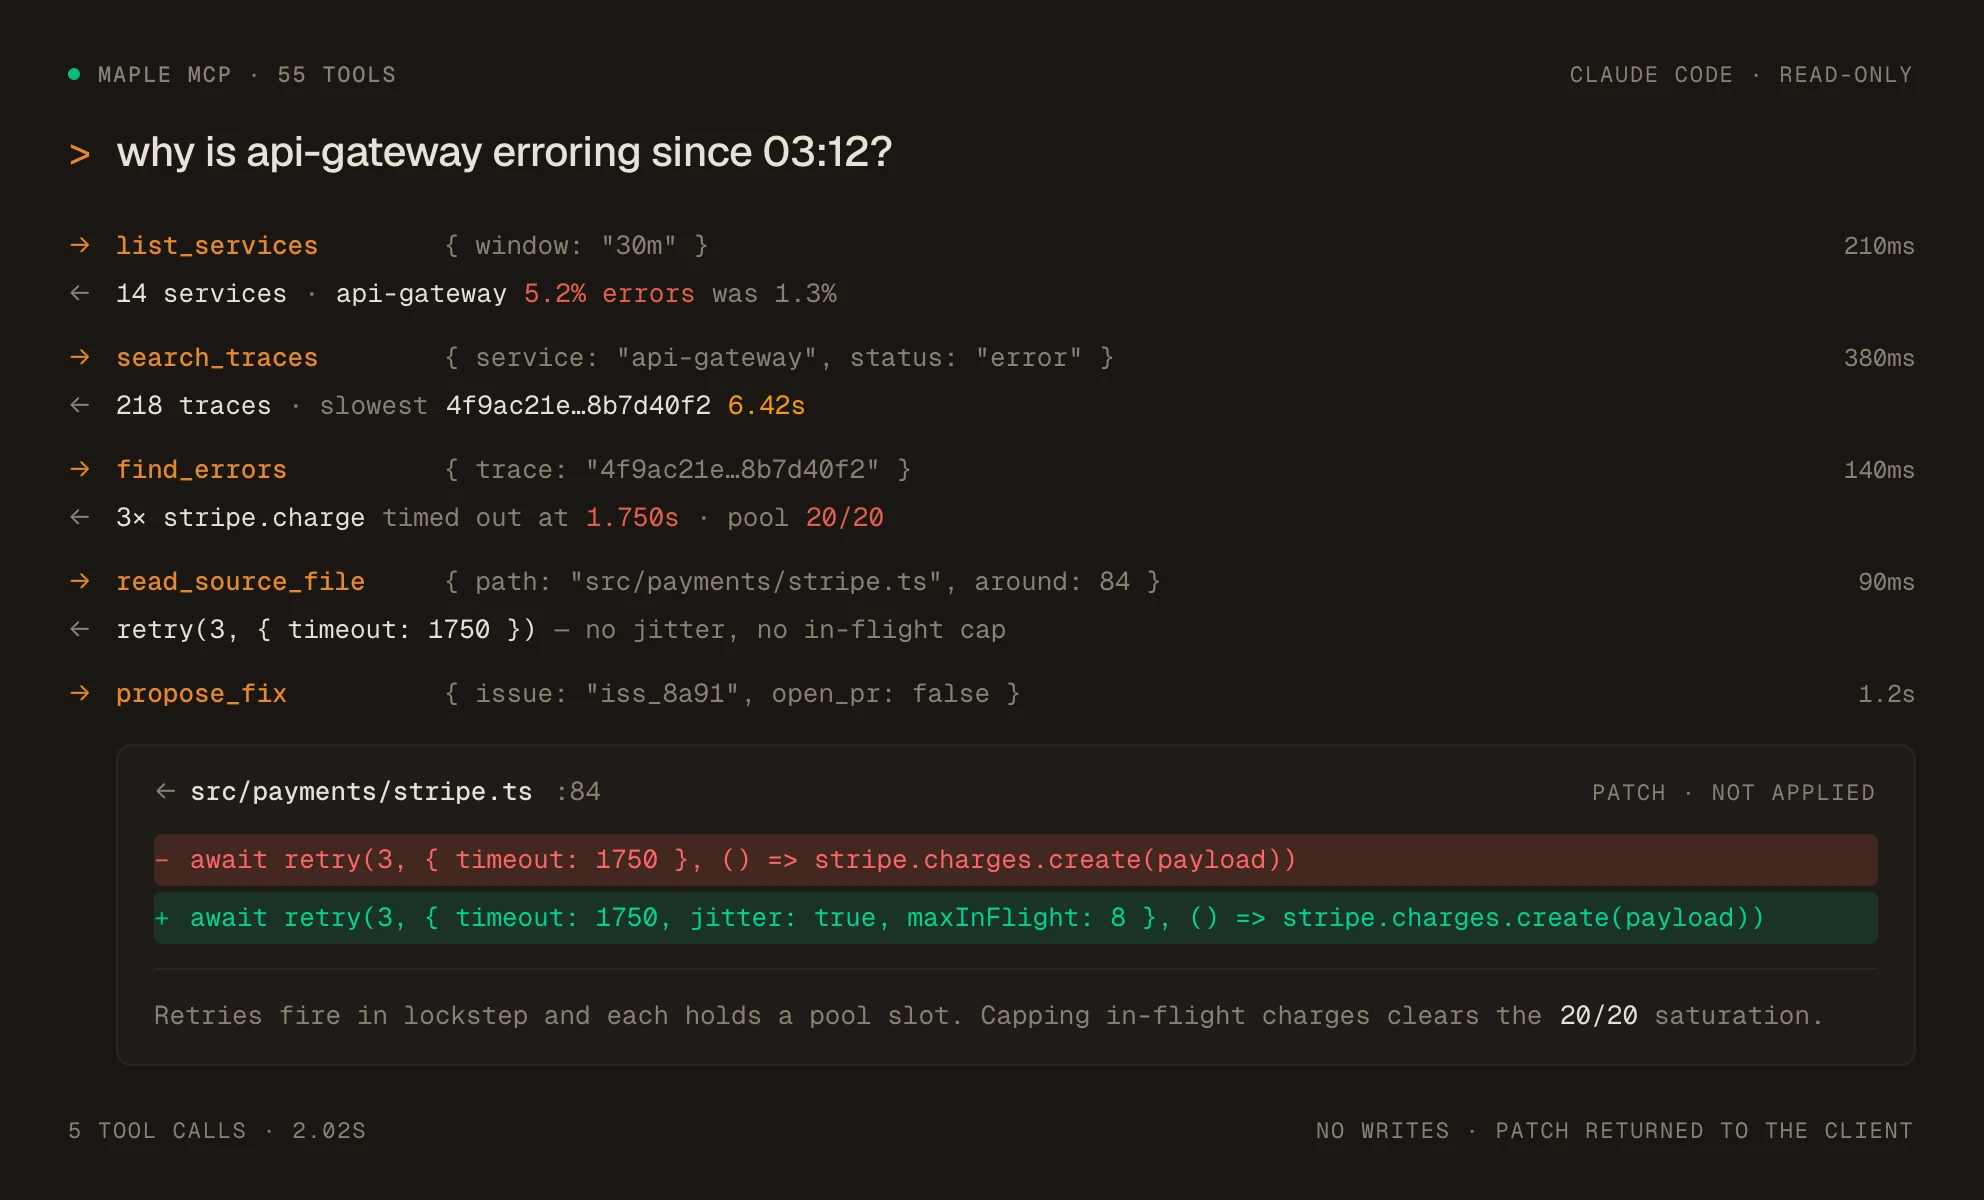
Maple groups error spans into issues by fingerprint. Each flare-up of an issue is an incident under it, and the issue page shows the stack, the occurrences and the traces behind them. For a browser app instrumented with the Browser SDK, a session replay plays back what the user saw next to the backend traces of that session.
The Maple MCP server at https://api.maple.dev/mcp gives Claude Code, Cursor or any other MCP client the same data, scoped to your organization. The MCP page under Settings shows the endpoint and ready-made configuration for common clients.
Data from Google Cloud (Cloud Logging and Cloud Monitoring), Cloudflare (zone and Workers analytics), PlanetScale (branch metrics), Railway (service metrics), any Prometheus endpoint and GitHub Actions is stored in the same log, metric and trace tables as your own telemetry. One query layer covers all of it, so an agent can follow a root cause from a failing checkout to a saturated database or a red deploy without switching tools.
Prevent Postmortem data, verified fixes and Code Review
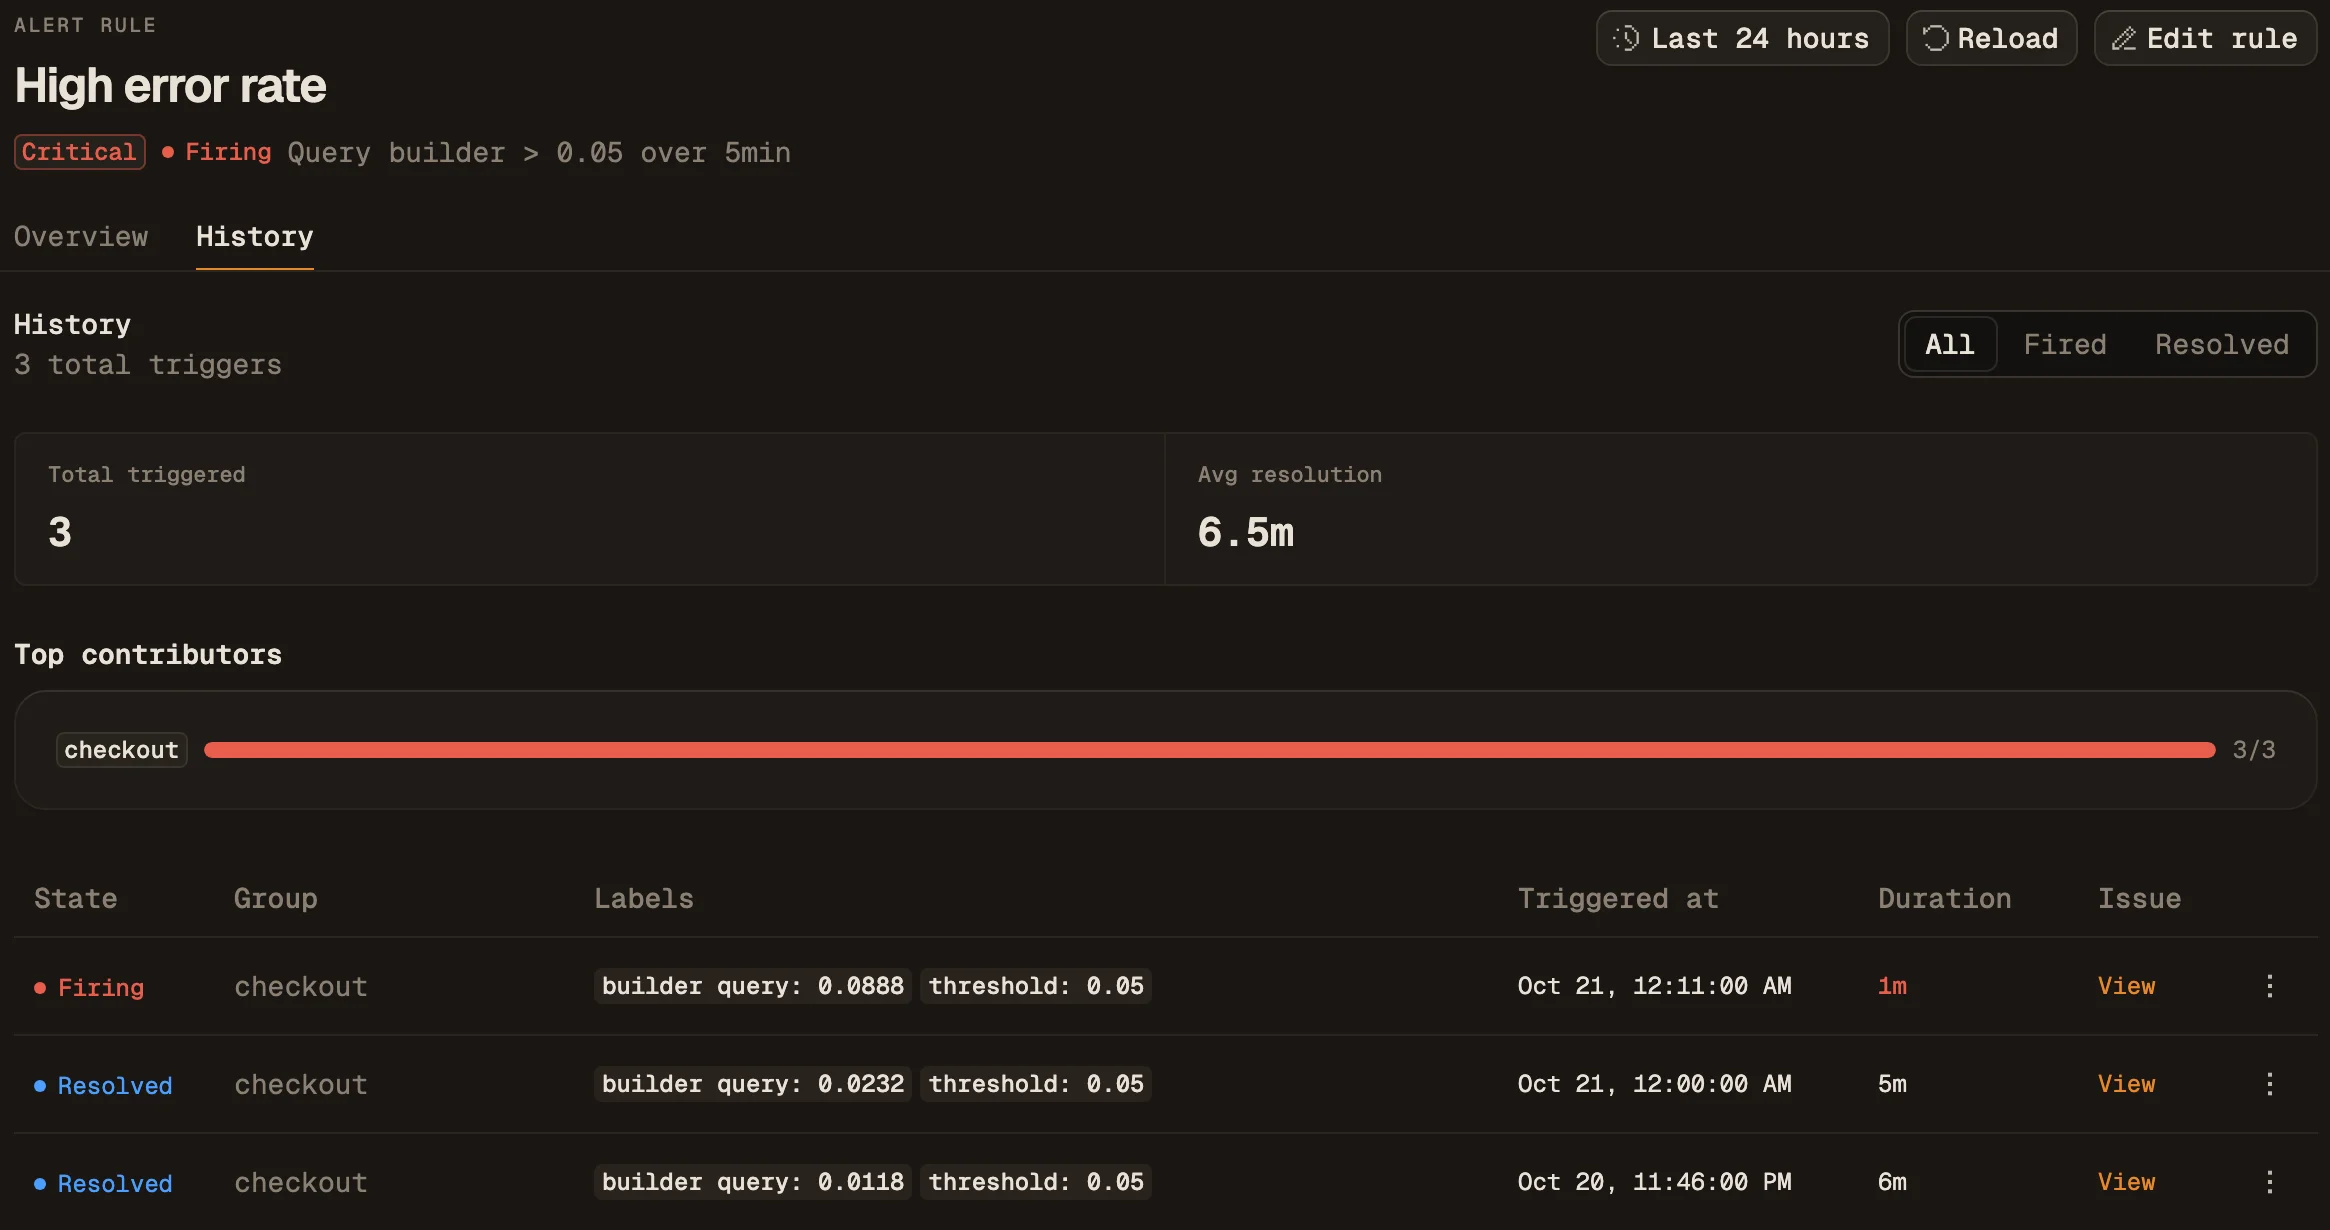
An alert incident resolves after Healthy to resolve healthy checks in a row and sends a resolve notification. The rule's History tab lists its past incidents with Total triggered and Avg resolution, and list_alert_incidents returns the same data to an assistant drafting the postmortem.
Attach the fix's pull request to the error issue (Attach in the issue's Pull requests panel, or link_pull_request). When it merges, the issue moves to Verifying and Maple counts occurrences from builds that postdate the merge. If the error keeps firing, the issue goes back to In progress; if it returns after the issue is done, it is marked Regressed. See fix verification.
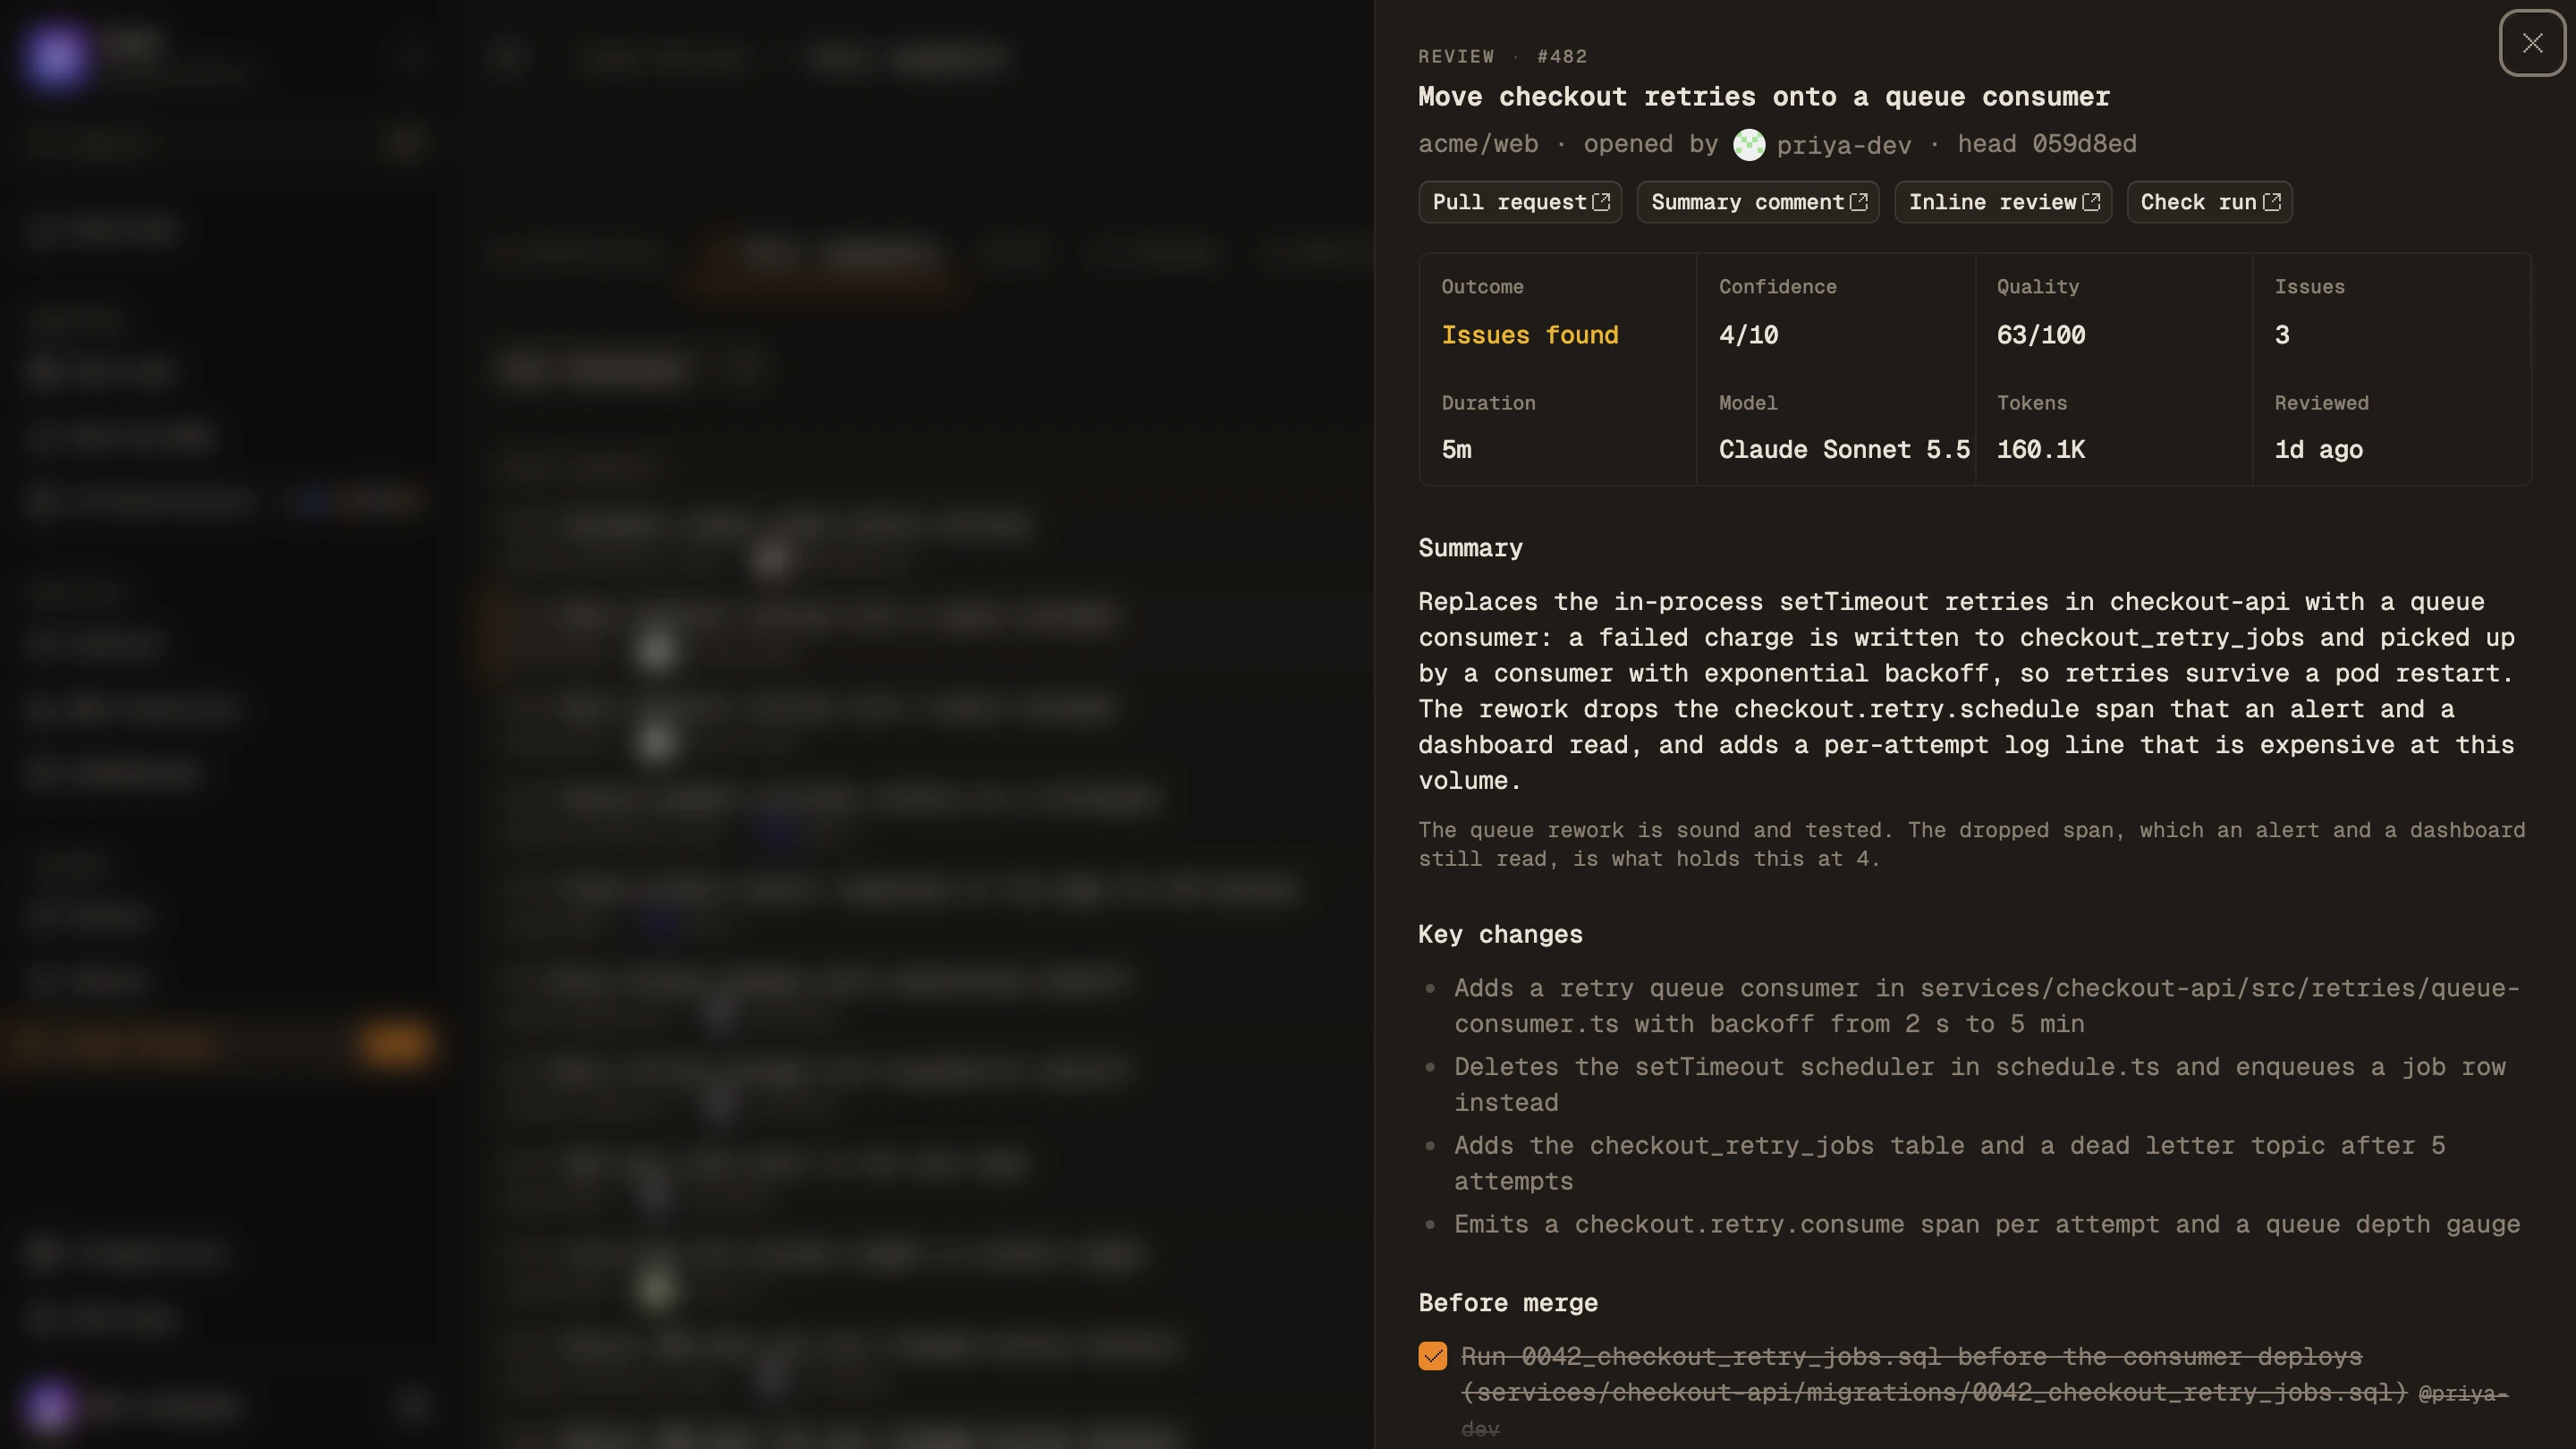
Code Review (in beta, through the GitHub integration) reviews every push to a pull request with a summary comment, an inline review and a check run. Findings cite the traffic, errors and alerts behind the lines that changed, and removing a span, attribute or metric that an alert or dashboard reads is flagged before it ships. Deploy steps found in the diff, such as migrations, env vars and secrets, become a checklist. An hour after the deploy, Maple compares the hour before with the hour after and comments on the pull request with new errors and any telemetry that stopped arriving.
Set it up in Maple
Your first alert rule
Every rule setting, when incidents open and resolve, and what each notification contains.
References
- NIST SP 800-61 Rev. 2: Computer Security Incident Handling Guide (2012), four phases: Preparation; Detection and Analysis; Containment, Eradication and Recovery; Post-Incident Activity
- NIST SP 800-61 Rev. 3 (2025), which files incident response under the NIST Cybersecurity Framework 2.0 functions
- SANS Institute: Incident Handler's Handbook, six steps: Preparation, Identification, Containment, Eradication, Recovery, Lessons Learned
- Google SRE book: Postmortem Culture
- Maple docs: Alert rules · Incidents · Errors and issues · MCP server · GitHub
- Maple guide: Uptime monitoring with traces and HTTP checks