
Log parsing is splitting raw log lines into structured fields, such as the timestamp, the severity, the status code or the URL path. Once a line is parsed, tools can filter, count and alert on those fields instead of searching free text.
This guide covers the common log formats and the techniques and tools used to parse them, how to parse logs in the OpenTelemetry Collector with a config for each format, how to write a parser for your own format, and how to parse a log file by hand.
Key takeaways
- The format decides the parser: JSON, logfmt and syslog have their own, other text needs a regex with named groups.
- Parse once in a pipeline such as the OpenTelemetry Collector, so every backend gets the same fields.
- Convert status codes and sizes to integers: as text,
"502" >= "60"is false. - Let lines that don't match through with their raw body; they are often the ones worth reading.
- For code you own, log JSON from a structured logger instead of parsing text later.
01 · Definition
Log parsing, defined
Here is one request from an nginx access log, before and after parsing. Each color is one field, and the same colors mark that field in the regex and config further down.
Raw line
Parsed record
?expand=items, the protocol and the referrer. The severity is worked out from the status code.
To a log store, the raw line is one string. Counting the 5xx responses from /api/checkout means running a pattern over every line each time you ask. Once url.path and http.response.status_code are fields, the same question is a filter and a group-by, and a status code stored as the integer 502 can be compared with >= 500.
Parsing before export does the work once, close to the source, so every backend receives the same structured, searchable fields and none of them needs its own parsing rules at query time.
02 · Formats
Log formats and parsing techniques
The format of a log decides the parser. Most logs are one of these:
| Format | Looks like | Parse with |
|---|---|---|
| Web server access logs | 203.0.113.7 - - [19/Oct/2026...] "GET /api..." 200 | A regex with named groups |
| JSON lines | {"level":"error","msg":"payment declined"} | A JSON parser |
| logfmt, key=value | level=warn msg="cache miss" | A key-value parser |
| Syslog | <34>1 2026-10-19T14:02:11Z web-01 sshd ... | A syslog parser |
| Multiline stack traces | A dated line, then at com.example... frames | Join the lines, then a regex |
Any text format without a dedicated parser falls back to a regular expression, where each named group, written (?P<name>...), becomes a field. Grok, popularized by Logstash, is regex with a library of ready-made named patterns: %{IP:client} matches an IP address, and %{HTTPD_COMBINEDLOG} matches a whole nginx or Apache line. The next section has a Collector config for each format in the table.
Log parsing tools
| Tool | What it is | License | Pricing | Best for |
|---|---|---|---|---|
| OpenTelemetry Collector | Vendor-agnostic pipeline that receives, processes and exports logs, metrics and traces | Open source, Apache 2.0 | Free | Parsing once and sending to any OTLP backend |
| Fluent Bit | Lightweight processor and forwarder for logs, metrics and traces; a CNCF graduated project | Open source, Apache 2.0 | Free | An agent on every node or container |
| Logstash | Elastic's server-side pipeline; grok turns unstructured text into fields | Apache 2.0 for the -oss build, Elastic License for the default build | Free to self-host | Elastic Stack users and grok patterns |
| Vector | Observability pipeline maintained by Datadog; parses with Vector Remap Language | Open source, MPL 2.0 | Free | Programmable transforms in one binary |
| Graylog | Log management with pipeline processing, search and alerts | Graylog Open: SSPL; Enterprise and Security editions are paid | Open is free; Enterprise uses value-based licensing | Self-hosted log search with parsing built in |
| Splunk | Commercial data platform; the rex command extracts fields with a regex at search time | Proprietary | Ingest, workload, entity or activity pricing; free trials | Teams already on Splunk |
Maple stores logs that arrive over OTLP, so this guide parses them in the Collector before they are sent.
03 · Pipeline
Parse logs in the OpenTelemetry Collector
The OpenTelemetry Collector is a free, open-source program that receives logs, metrics and traces, processes them and sends them on to a backend. It is the usual place to parse logs:
- One config parses the logs of every app on the host, so no app needs its own parsing code.
- It works for software you can't change, such as nginx, databases and vendor daemons.
- It is vendor-neutral. Switching backends means changing the exporter, not rewriting the parsers.
- Your logs already pass through it on the way to the backend, so parsing there adds no extra hop.
The file log receiver
Most apps and servers write their logs to a file. The Collector's file log receiver, file_log in the config, watches that file and picks up each new line as it is written. A list of operators parses the line into fields, and an exporter sends the finished record to your backend.
- Your appwrites log lines
- access.loga file on disk
- file_log receiverpicks up new lines, parses them
- otlp_http exportersends records over OTLP
- Your backendMaple in this example
The receiver ships in otelcol-contrib, the Collector build published as the Docker image otel/opentelemetry-collector-contrib. Older versions name it filelog and the exporter otlphttp; the configs here use the current names.
Pick your log format
Each tab has a sample line, a complete config.yaml for that format, and the record Collector 0.164.0 printed for the line in a test run.
Sample line
203.0.113.7 - - [19/Oct/2026:14:02:11 +0000] "GET /api/orders/42?expand=items HTTP/1.1" 200 1532 "https://shop.example.com/cart" "Mozilla/5.0 (X11; Linux x86_64)"
config.yaml
receivers:
    file_log/nginx:
        include: [/var/log/nginx/access.log]
        resource:
            service.name: nginx
        operators:
            - type: regex_parser
              regex: '^(?P<client_address>\S+) \S+ \S+ \[(?P<time_local>[^\]]+)\] "(?P<method>[A-Z]+) (?P<path>[^ ?"]+)[^ "]* HTTP/[0-9.]+" (?P<status>\d{3}) (?P<body_bytes>\d+|-) "[^"]*" "(?P<user_agent>[^"]*)"$'
              timestamp:
                  parse_from: attributes.time_local
                  layout: "%d/%b/%Y:%H:%M:%S %z"
              severity:
                  parse_from: attributes.status
                  overwrite_text: true
                  mapping:
                      info:
                          - min: 100
                            max: 399
                      warn: 4xx
                      error: 5xx
            # Operators run top to bottom, so the renames come after the parser
            # that creates the fields. Dots are not allowed in group names.
            - type: move
              from: attributes.client_address
              to: attributes["client.address"]
              on_error: send_quiet
            - type: move
              from: attributes.method
              to: attributes["http.request.method"]
              on_error: send_quiet
            - type: move
              from: attributes.path
              to: attributes["url.path"]
              on_error: send_quiet
            - type: move
              from: attributes.status
              to: attributes["http.response.status_code"]
              on_error: send_quiet
            - type: move
              from: attributes.body_bytes
              to: attributes["http.response.body.size"]
              on_error: send_quiet
            - type: move
              from: attributes.user_agent
              to: attributes["user_agent.original"]
              on_error: send_quiet
            - type: remove
              field: attributes.time_local
              on_error: send_quiet

processors:
    transform/nginx:
        error_mode: ignore
        log_statements:
            - delete_key(log.attributes, "http.response.body.size") where log.attributes["http.response.body.size"] == "-"
            - set(log.attributes["http.response.status_code"], Int(log.attributes["http.response.status_code"])) where log.attributes["http.response.status_code"] != nil
            - set(log.attributes["http.response.body.size"], Int(log.attributes["http.response.body.size"])) where log.attributes["http.response.body.size"] != nil
    batch: {}

exporters:
    otlp_http/maple:
        endpoint: https://ingest.maple.dev
        compression: gzip
        headers:
            x-maple-ingest-key: ${env:MAPLE_INGEST_KEY}

service:
    pipelines:
        logs:
            receivers: [file_log/nginx]
            processors: [transform/nginx, batch]
            exporters: [otlp_http/maple]
Parsed record
Resource attributes:
     -> service.name: Str(nginx)
Timestamp: 2026-10-19 14:02:11 +0000 UTC
SeverityText: INFO
Attributes:
     -> client.address: Str(203.0.113.7)
     -> http.request.method: Str(GET)
     -> url.path: Str(/api/orders/42)
     -> http.response.status_code: Int(200)
     -> http.response.body.size: Int(1532)
     -> user_agent.original: Str(Mozilla/5.0 (X11; Linux x86_64))
     -> log.file.name: Str(access.log)
regex_parser captures the fields, reads the timestamp and works out the severity from the status code. The move operators rename the fields, and the transform processor turns the status and size into integers. Apache's combined format writes the same fields in the same order, so this config parses it too. Parse your own format walks through each part.
Sample line
{"ts":"2026-10-19T14:02:11.482Z","level":"error","msg":"payment declined","order_id":"ord_8812","attempt":2}
config.yaml
receivers:
    file_log/app:
        include: [/var/log/app/app.log]
        resource:
            service.name: app
        operators:
            - type: json_parser
              timestamp:
                  parse_from: attributes.ts
                  layout_type: gotime
                  layout: "2006-01-02T15:04:05Z07:00"
              severity:
                  parse_from: attributes.level
            - type: move
              from: attributes.msg
              to: body
              on_error: send_quiet

processors:
    batch: {}

exporters:
    otlp_http/maple:
        endpoint: https://ingest.maple.dev
        compression: gzip
        headers:
            x-maple-ingest-key: ${env:MAPLE_INGEST_KEY}

service:
    pipelines:
        logs:
            receivers: [file_log/app]
            processors: [batch]
            exporters: [otlp_http/maple]
Parsed record
Resource attributes:
     -> service.name: Str(app)
Timestamp: 2026-10-19 14:02:11.482 +0000 UTC
SeverityText: error
Body: Str(payment declined)
Attributes:
     -> ts: Str(2026-10-19T14:02:11.482Z)
     -> level: Str(error)
     -> order_id: Str(ord_8812)
     -> attempt: Double(2)
     -> log.file.name: Str(app.log)
json_parser turns every key into an attribute and takes the timestamp and severity from ts and level. move puts the message in the body. JSON numbers arrive as floats, so attempt is a Double. A line that isn't JSON is passed on unparsed.
Sample line
time=2026-10-19T14:02:11Z level=warn msg="cache miss" key=user:42 duration_ms=18
config.yaml
receivers:
    file_log/worker:
        include: [/var/log/worker/worker.log]
        resource:
            service.name: worker
        operators:
            - type: key_value_parser
              timestamp:
                  parse_from: attributes.time
                  layout_type: gotime
                  layout: "2006-01-02T15:04:05Z07:00"
              severity:
                  parse_from: attributes.level

processors:
    batch: {}

exporters:
    otlp_http/maple:
        endpoint: https://ingest.maple.dev
        compression: gzip
        headers:
            x-maple-ingest-key: ${env:MAPLE_INGEST_KEY}

service:
    pipelines:
        logs:
            receivers: [file_log/worker]
            processors: [batch]
            exporters: [otlp_http/maple]
Parsed record
Resource attributes:
     -> service.name: Str(worker)
Timestamp: 2026-10-19 14:02:11 +0000 UTC
SeverityText: warn
Attributes:
     -> time: Str(2026-10-19T14:02:11Z)
     -> level: Str(warn)
     -> msg: Str(cache miss)
     -> key: Str(user:42)
     -> duration_ms: Str(18)
     -> log.file.name: Str(worker.log)
key_value_parser splits pairs on spaces and keys from values on =, and keeps quoted values whole. Every value is a string, duration_ms included.
Sample line
2026-10-19 14:02:11,482 ERROR [http-nio-8080-exec-3] c.e.CheckoutController - Checkout failed java.lang.IllegalStateException: cart is empty at com.example.CheckoutService.submit(CheckoutService.java:88) at com.example.CheckoutController.post(CheckoutController.java:41)
config.yaml
receivers:
    file_log/checkout:
        include: [/var/log/checkout/app.log]
        resource:
            service.name: checkout
        # A new entry starts at a line beginning with a date. Other lines, such
        # as stack frames, are appended to the entry before them.
        multiline:
            line_start_pattern: '^\d{4}-\d{2}-\d{2} '
        operators:
            - type: regex_parser
              regex: '(?s)^(?P<time>\S+ \S+) (?P<level>[A-Z]+)\s+\[(?P<thread>[^\]]+)\] (?P<logger>\S+) - (?P<message>.*)$'
              timestamp:
                  parse_from: attributes.time
                  layout: "%Y-%m-%d %H:%M:%S,%L"
                  location: UTC
              severity:
                  parse_from: attributes.level

processors:
    batch: {}

exporters:
    otlp_http/maple:
        endpoint: https://ingest.maple.dev
        compression: gzip
        headers:
            x-maple-ingest-key: ${env:MAPLE_INGEST_KEY}

service:
    pipelines:
        logs:
            receivers: [file_log/checkout]
            processors: [batch]
            exporters: [otlp_http/maple]
Parsed record
Resource attributes:
     -> service.name: Str(checkout)
Timestamp: 2026-10-19 14:02:11.482 +0000 UTC
SeverityText: ERROR
Attributes:
     -> time: Str(2026-10-19 14:02:11,482)
     -> level: Str(ERROR)
     -> thread: Str(http-nio-8080-exec-3)
     -> logger: Str(c.e.CheckoutController)
     -> message: Str(Checkout failed
java.lang.IllegalStateException: cart is empty
	at com.example.CheckoutService.submit(CheckoutService.java:88)
	at com.example.CheckoutController.post(CheckoutController.java:41))
     -> log.file.name: Str(app.log)
The Java stack trace arrives as one record instead of one per line. line_start_pattern marks where an entry starts, and (?s) lets the message group run across the line breaks.
Sample line
<34>1 2026-10-19T14:02:11.003Z web-01 sshd 2211 - - Failed password for invalid user admin from 198.51.100.4 port 52113 ssh2
config.yaml
receivers:
    file_log/syslog:
        include: [/var/log/remote/hosts.log]
        resource:
            service.name: syslog
        operators:
            - type: syslog_parser
              protocol: rfc5424

processors:
    batch: {}

exporters:
    otlp_http/maple:
        endpoint: https://ingest.maple.dev
        compression: gzip
        headers:
            x-maple-ingest-key: ${env:MAPLE_INGEST_KEY}

service:
    pipelines:
        logs:
            receivers: [file_log/syslog]
            processors: [batch]
            exporters: [otlp_http/maple]
Parsed record
Resource attributes:
     -> service.name: Str(syslog)
Timestamp: 2026-10-19 14:02:11.003 +0000 UTC
SeverityText: crit
Attributes:
     -> priority: Int(34)
     -> facility: Int(4)
     -> facility_text: Str(auth)
     -> version: Int(1)
     -> hostname: Str(web-01)
     -> appname: Str(sshd)
     -> proc_id: Str(2211)
     -> message: Str(Failed password for invalid user admin from 198.51.100.4 port 52113 ssh2)
     -> log.file.name: Str(hosts.log)
<34> is the priority, from which the parser reads the facility (auth) and the severity (crit). For older BSD-style lines, set protocol: rfc3164. Syslog sent over the network goes to the Collector's syslog receiver instead, which parses it the same way.
The exporter at the bottom of each config sends the records over OTLP, the OpenTelemetry protocol, to Maple in this example. For another backend, change endpoint and headers; the receiver and its operators stay the same. For Maple, the key is the private ingest key (maple_sk_...) from the Ingestion page in Maple's settings, and organizations in the EU region use https://ingest.eu.maple.dev.
Run it
Check the parsing before anything is sent. debug.yaml swaps the exporter for one that prints each record; the Collector merges every --config file it is given, so config.yaml stays unchanged:
debug.yaml
# debug.yaml: print parsed records instead of exporting them
exporters:
    debug:
        verbosity: detailed

service:
    pipelines:
        logs:
            exporters: [debug]
Start the Collector with Docker from the folder that holds both files. Mount the folder your log file is in at the path the config's include names; for nginx, that is /var/log/nginx:
docker run --rm \
  -v "$PWD/config.yaml:/etc/otelcol-contrib/config.yaml:ro" \
  -v "$PWD/debug.yaml:/etc/otelcol-contrib/debug.yaml:ro" \
  -v /var/log/nginx:/var/log/nginx:ro \
  otel/opentelemetry-collector-contrib:0.164.0 \
  --config /etc/otelcol-contrib/config.yaml --config /etc/otelcol-contrib/debug.yaml
The receiver reads lines written after it starts, so send a request to nginx. A 502 from /api/checkout prints as:
Resource attributes:
     -> service.name: Str(nginx)
Timestamp: 2026-10-19 14:02:12 +0000 UTC
SeverityText: ERROR
SeverityNumber: Error(17)
Body: Str(198.51.100.23 - alice [19/Oct/2026:14:02:12 +0000] "POST /api/checkout HTTP/2.0" 502 157 "-" "curl/8.5.0")
Attributes:
     -> client.address: Str(198.51.100.23)
     -> http.request.method: Str(POST)
     -> url.path: Str(/api/checkout)
     -> http.response.status_code: Int(502)
     -> http.response.body.size: Int(157)
     -> user_agent.original: Str(curl/8.5.0)
     -> log.file.name: Str(access.log)
When the records look right, start it in the background with your ingest key and without debug.yaml:
docker run -d --name otelcol \
  -e MAPLE_INGEST_KEY=YOUR_INGEST_KEY \
  -v "$PWD/config.yaml:/etc/otelcol-contrib/config.yaml:ro" \
  -v /var/log/nginx:/var/log/nginx:ro \
  otel/opentelemetry-collector-contrib:0.164.0
If nothing arrives
permission deniedindocker logs otelcol: the container can't read the file. On Debian and Ubuntu, nginx logs belong to theadmgroup, group ID 4, so add--group-add 4.- Older lines are missing: add
start_at: beginningunder the receiver to read the whole file first.
See the parsed fields
Backends that accept OTLP store the parsed fields as log attributes. In Maple, for example:
- 01
Filter and open a record
Open Logs and pick
nginxunder Service. ExcludingINFOunder Severity leaves the 4xx and 5xx responses. Open a record: its Attributes tab lists the parsed fields under Log Attributes.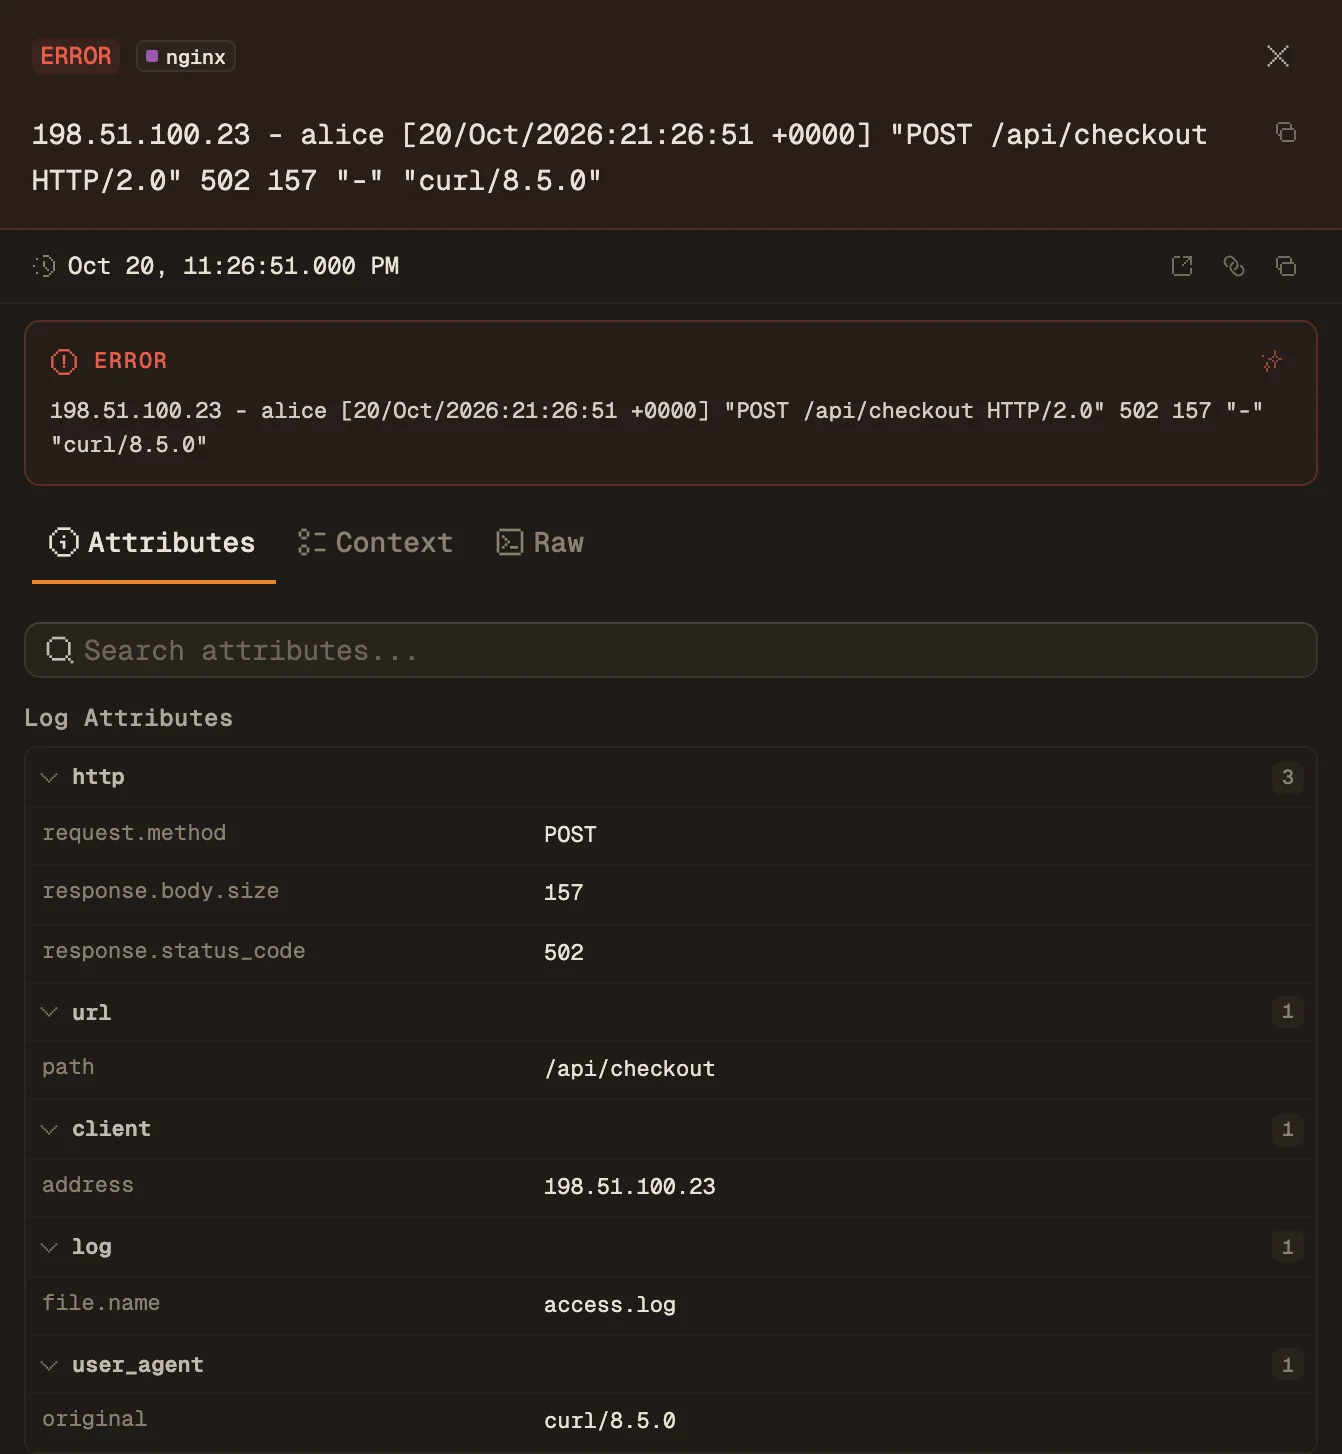
- 02
Pin fields as columns
Use Columns in the table toolbar to pin
url.pathandhttp.response.status_codenext to the message. For charts, a dashboard's Query Builder over Logs can group byattr.url.path(Build dashboards).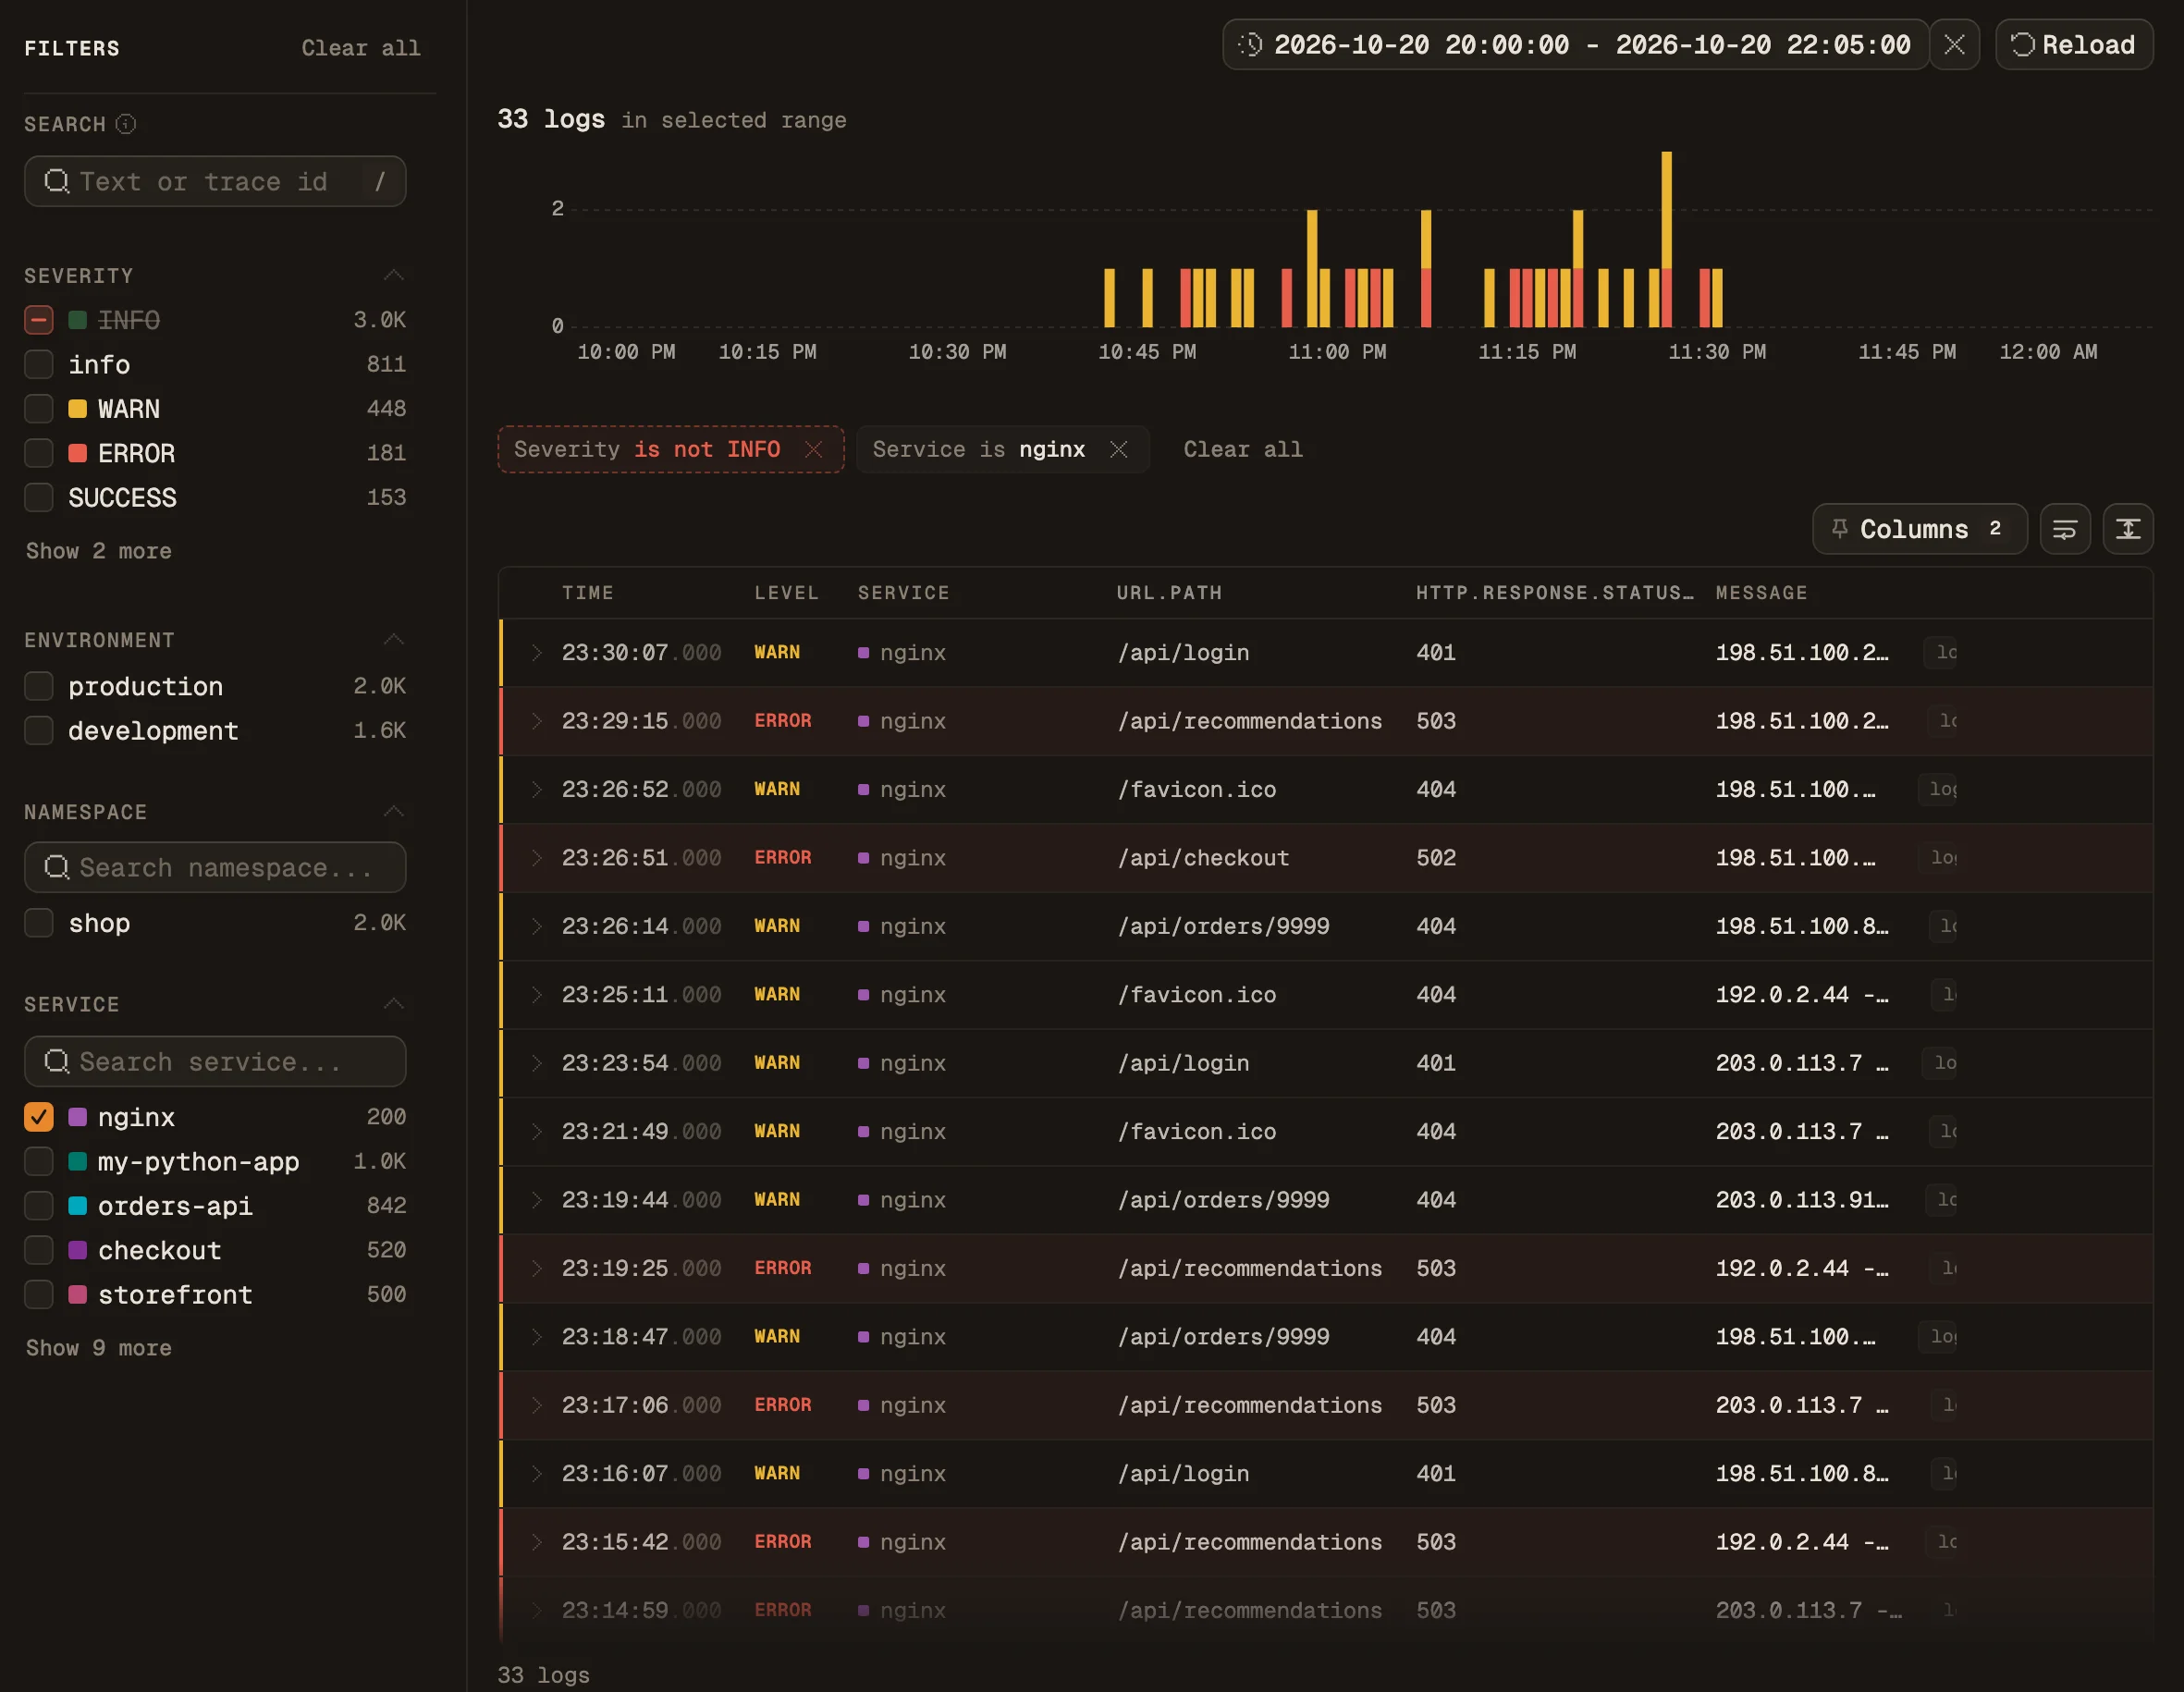
Parsed logs in Maple
Send your parsed logs to Maple
The Logs docs cover search, the sidebar filters, pinned columns and moving from a log to its trace.
04 · Your format
Parse your own log format, step by step
When no tab matches your logs, build the parser yourself. These steps work for any text format, with the nginx config as the worked example:
- 01
Copy a few sample lines
Take real lines from the file, including an unusual one: an error, an empty field, a request from a scanner. For nginx, the line in the overview diagram.
- 02
Write a regex with one named group per field
Match the text between fields literally and capture each field with
(?P<name>...). For the nginx line, in the overview's colors:^(?P<client_address>\S+) \S+ \S+ \[(?P<time_local>[^\]]+)\] "(?P<method>[A-Z]+) (?P<path>[^ ?"]+)[^ "]* HTTP/[0-9.]+" (?P<status>\d{3}) (?P<body_bytes>\d+|-) "[^"]*" "(?P<user_agent>[^"]*)"$\S+matches up to the next space,[^\]]+up to the closing bracket and[^"]*anything inside a pair of quotes. Thepathgroup stops at?, which leaves the query string out. Put the regex in aregex_parseroperator. - 03
Rename the fields
Group names can't contain dots, so a
moveoperator renames each one to its OpenTelemetry semantic-convention name, such asstatustohttp.response.status_code. Backends recognize the standard names. - 04
Set the timestamp and severity
The parser's
timestampblock reads the time field with its layout,%d/%b/%Y:%H:%M:%S %zfor nginx. Itsseverityblock reads the level; nginx has none, so the mapping derives one from the status: 100 to 399 isinfo,4xxiswarnand5xxiserror. - 05
Fix types, then check the output
Every regex group is a string. The
transformprocessor converts the ones you compare as numbers withInt(). Run withdebug.yamland compare each printed record with its sample line before you export.
05 · Best practices
Log parsing best practices and common mistakes
A parser that looks right on the sample line can still lose data in these ways:
A loose regex
Anchor the pattern with ^ and $ so a partial match can't fill half the fields, and use negated classes such as [^"]* instead of .*, which backtracks across the rest of the line.
Keeping query strings
Query strings carry session tokens, emails and IDs. The path group in this guide stops at ?, so they never reach an attribute.
Numbers left as strings
Regex groups and logfmt values are strings, and "502" >= "60" is false as text. Convert status codes and sizes to integers, as the nginx config does with Int().
One record per stack frame
Read line by line, a 40-line stack trace becomes 40 log records with no error message on most of them. Join the lines before parsing, as the Multiline config does.
Dropping lines that don't match
on_error: drop discards exactly the lines worth reading: malformed requests, scanners, a format change after a deploy. Let them through with their raw body.
Parsing logs you write yourself
For code you own, log JSON from a structured logger, or add an OpenTelemetry log bridge, which sends fields as attributes and links each log to its trace. See the instrumentation guides.
06 · Command line
Parse a log file by hand
For one answer from one file, or to work out an unfamiliar format before you write a Collector config, the shell is enough. The commands run on Linux and macOS; the examples use the nginx access log.
- 01
Look at a few lines
Print the first lines, then count the space-separated fields on each line. Different counts mean spaces alone can't split the format: here the request and the user agent contain spaces.
head -n 3 access.log
awk '{print NF}' access.log | sort -n | uniq -c
203.0.113.7 - - [19/Oct/2026:14:02:11 +0000] "GET /api/orders/42?expand=items HTTP/1.1" 200 1532 "https://shop.example.com/cart" "Mozilla/5.0 (X11; Linux x86_64)" 198.51.100.23 - alice [19/Oct/2026:14:02:12 +0000] "POST /api/checkout HTTP/2.0" 502 157 "-" "curl/8.5.0" 203.0.113.7 - - [19/Oct/2026:14:02:14 +0000] "GET /favicon.ico HTTP/1.1" 404 153 "https://shop.example.com/" "Mozilla/5.0 (X11; Linux x86_64)" 1 10 3 12 2 15 - 02
Split on a separator that holds
Look for characters that always enclose or separate a field: quotes, brackets,
=, braces. In nginx lines the double quotes do, soawk -F'"'finds the status in the same place on every line. JSON and key=value logs bring their own separators:# Split on the double quote: the status is the first word of piece 3 awk -F'"' '{split($3, f, " "); print f[1]}' access.log | sort | uniq -c | sort -rn2 502 1 404 1 400 1 204 1 200# -R reads each line as text, fromjson? skips lines that aren't JSON jq -cR 'fromjson? | select(.level == "error") | {ts, msg, order_id}' app.log{"ts":"2026-10-19T14:02:11.482Z","msg":"payment declined","order_id":"ord_8812"}# The slowest duration_ms in a logfmt log grep -oE 'duration_ms=[0-9]+' worker.log | cut -d= -f2 | sort -n | tail -n 1240 - 03
Test a regex on the whole file
Write the pattern with named groups and run it over every line. This script prints the fields of the first line and every line that doesn't match. Save it as
check_pattern.pyand runpython3 check_pattern.py access.log:import re import sys PATTERN = re.compile(r'^(?P<client_address>\S+) \S+ \S+ \[(?P<time_local>[^\]]+)\] "(?P<method>[A-Z]+) (?P<path>[^ ?"]+)[^ "]* HTTP/[0-9.]+" (?P<status>\d{3}) (?P<body_bytes>\d+|-) "[^"]*" "(?P<user_agent>[^"]*)"$') misses = 0 with open(sys.argv[1]) as f: for number, line in enumerate(f, start=1): match = PATTERN.match(line.rstrip("\n")) if match is None: misses += 1 print(f"no match on line {number}: {line[:60]}") elif number == 1: print(match.groupdict()) print(f"{misses} lines did not match"){'client_address': '203.0.113.7', 'time_local': '19/Oct/2026:14:02:11 +0000', 'method': 'GET', 'path': '/api/orders/42', 'status': '200', 'body_bytes': '1532', 'user_agent': 'Mozilla/5.0 (X11; Linux x86_64)'} no match on line 6: 192.0.2.44 - - [19/Oct/2026:14:02:17 +0000] "\x16\x03\x01\x0 1 lines did not matchLine 6 is a TLS handshake sent to the plain-HTTP port. In the Collector, a line like it passes through unparsed with its raw text.
- 04
Move it into the Collector
Paste the pattern into
regex_parser, in single quotes. Python and the Collector use the same(?P<name>...)syntax, but the Collector's Go regex engine has no lookarounds or backreferences, so leave those out. Then follow steps 3 to 5 of Parse your own log format.
Sources and further reading