Open-source observability. Built on OpenTelemetry. Your agent reads it too.
Query your traces, logs, metrics, and session replay in under a second. $39/month includes 100 GB of each signal. No per-host or per-seat fees.


-
Self-host the whole thing
Every line of Maple's source is on GitHub under FSL-1.1, and each release becomes Apache 2.0 after two years. Run it on your own infrastructure with no license call.
Read the source -
No proprietary agent
Maple speaks plain OpenTelemetry. Point an OTLP exporter at it and keep the instrumentation you already wrote. If you leave, there is nothing to rip out.
See instrumentation -
Hosted in the US or the EU us eu
Choose the EU when you sign up and your telemetry is stored and processed in Frankfurt. Same plan and price in both regions.
About EU hosting -
$39/month, 14-day free trial
A card is required to start the trial and nothing is charged until it ends. No per-seat, per-host or per-query fees at any volume.
See what it costs
01 · Signals
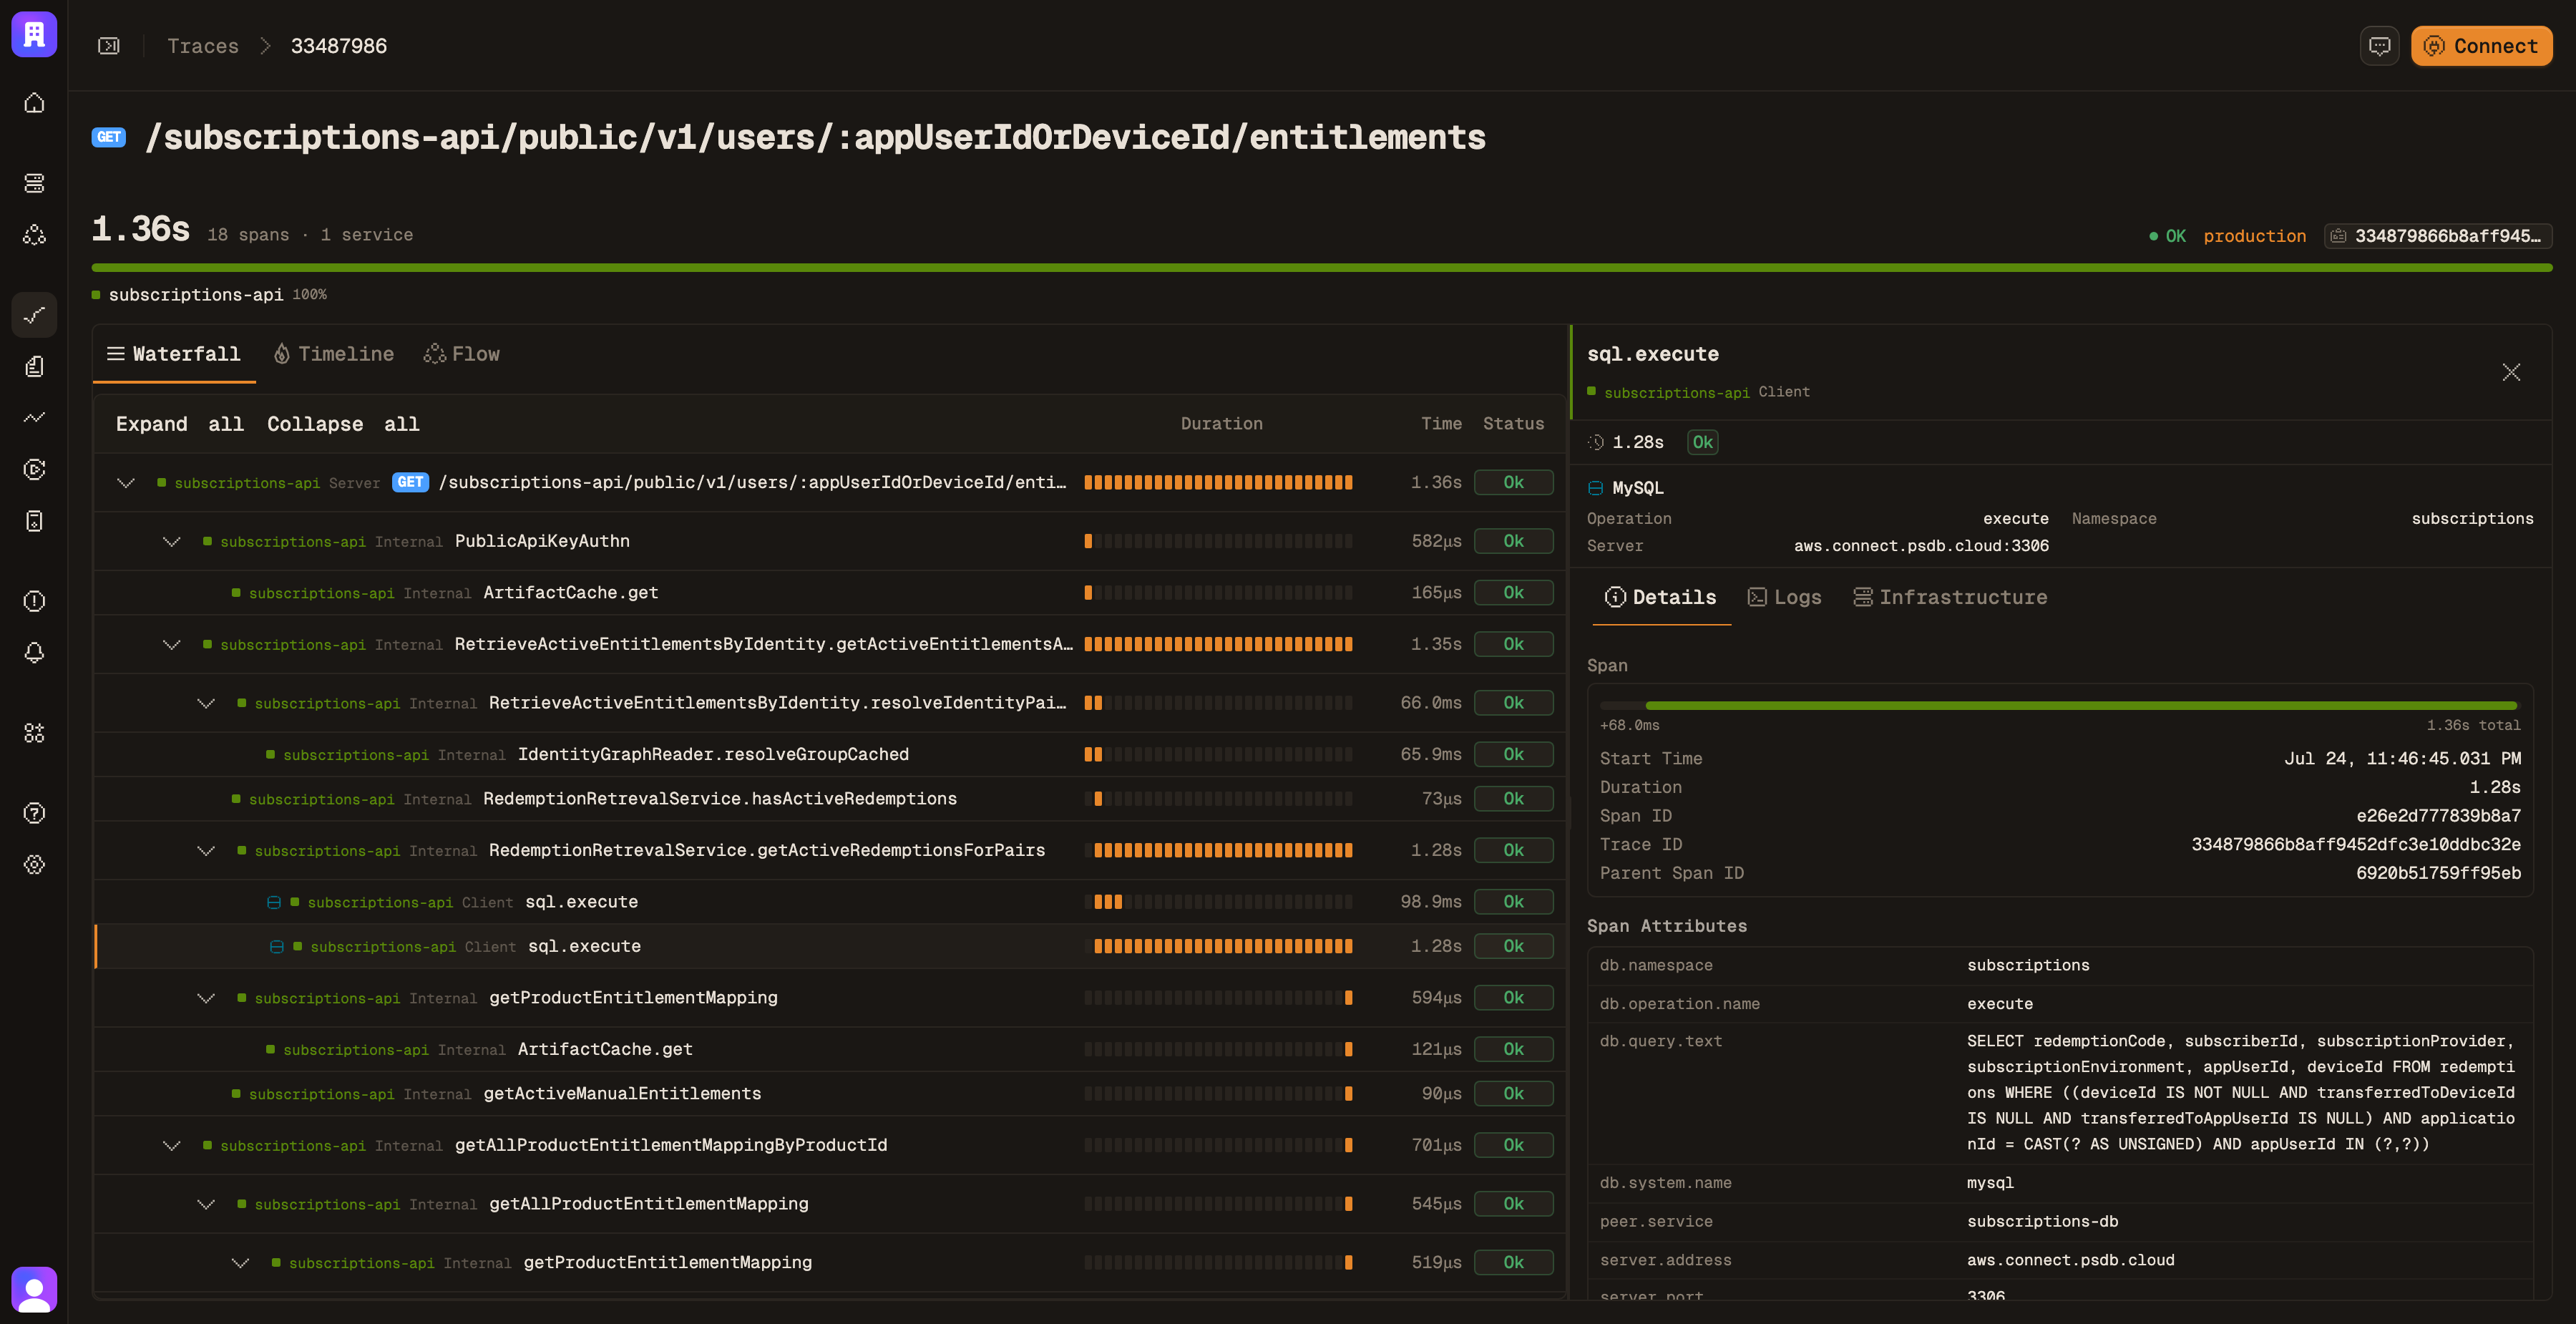
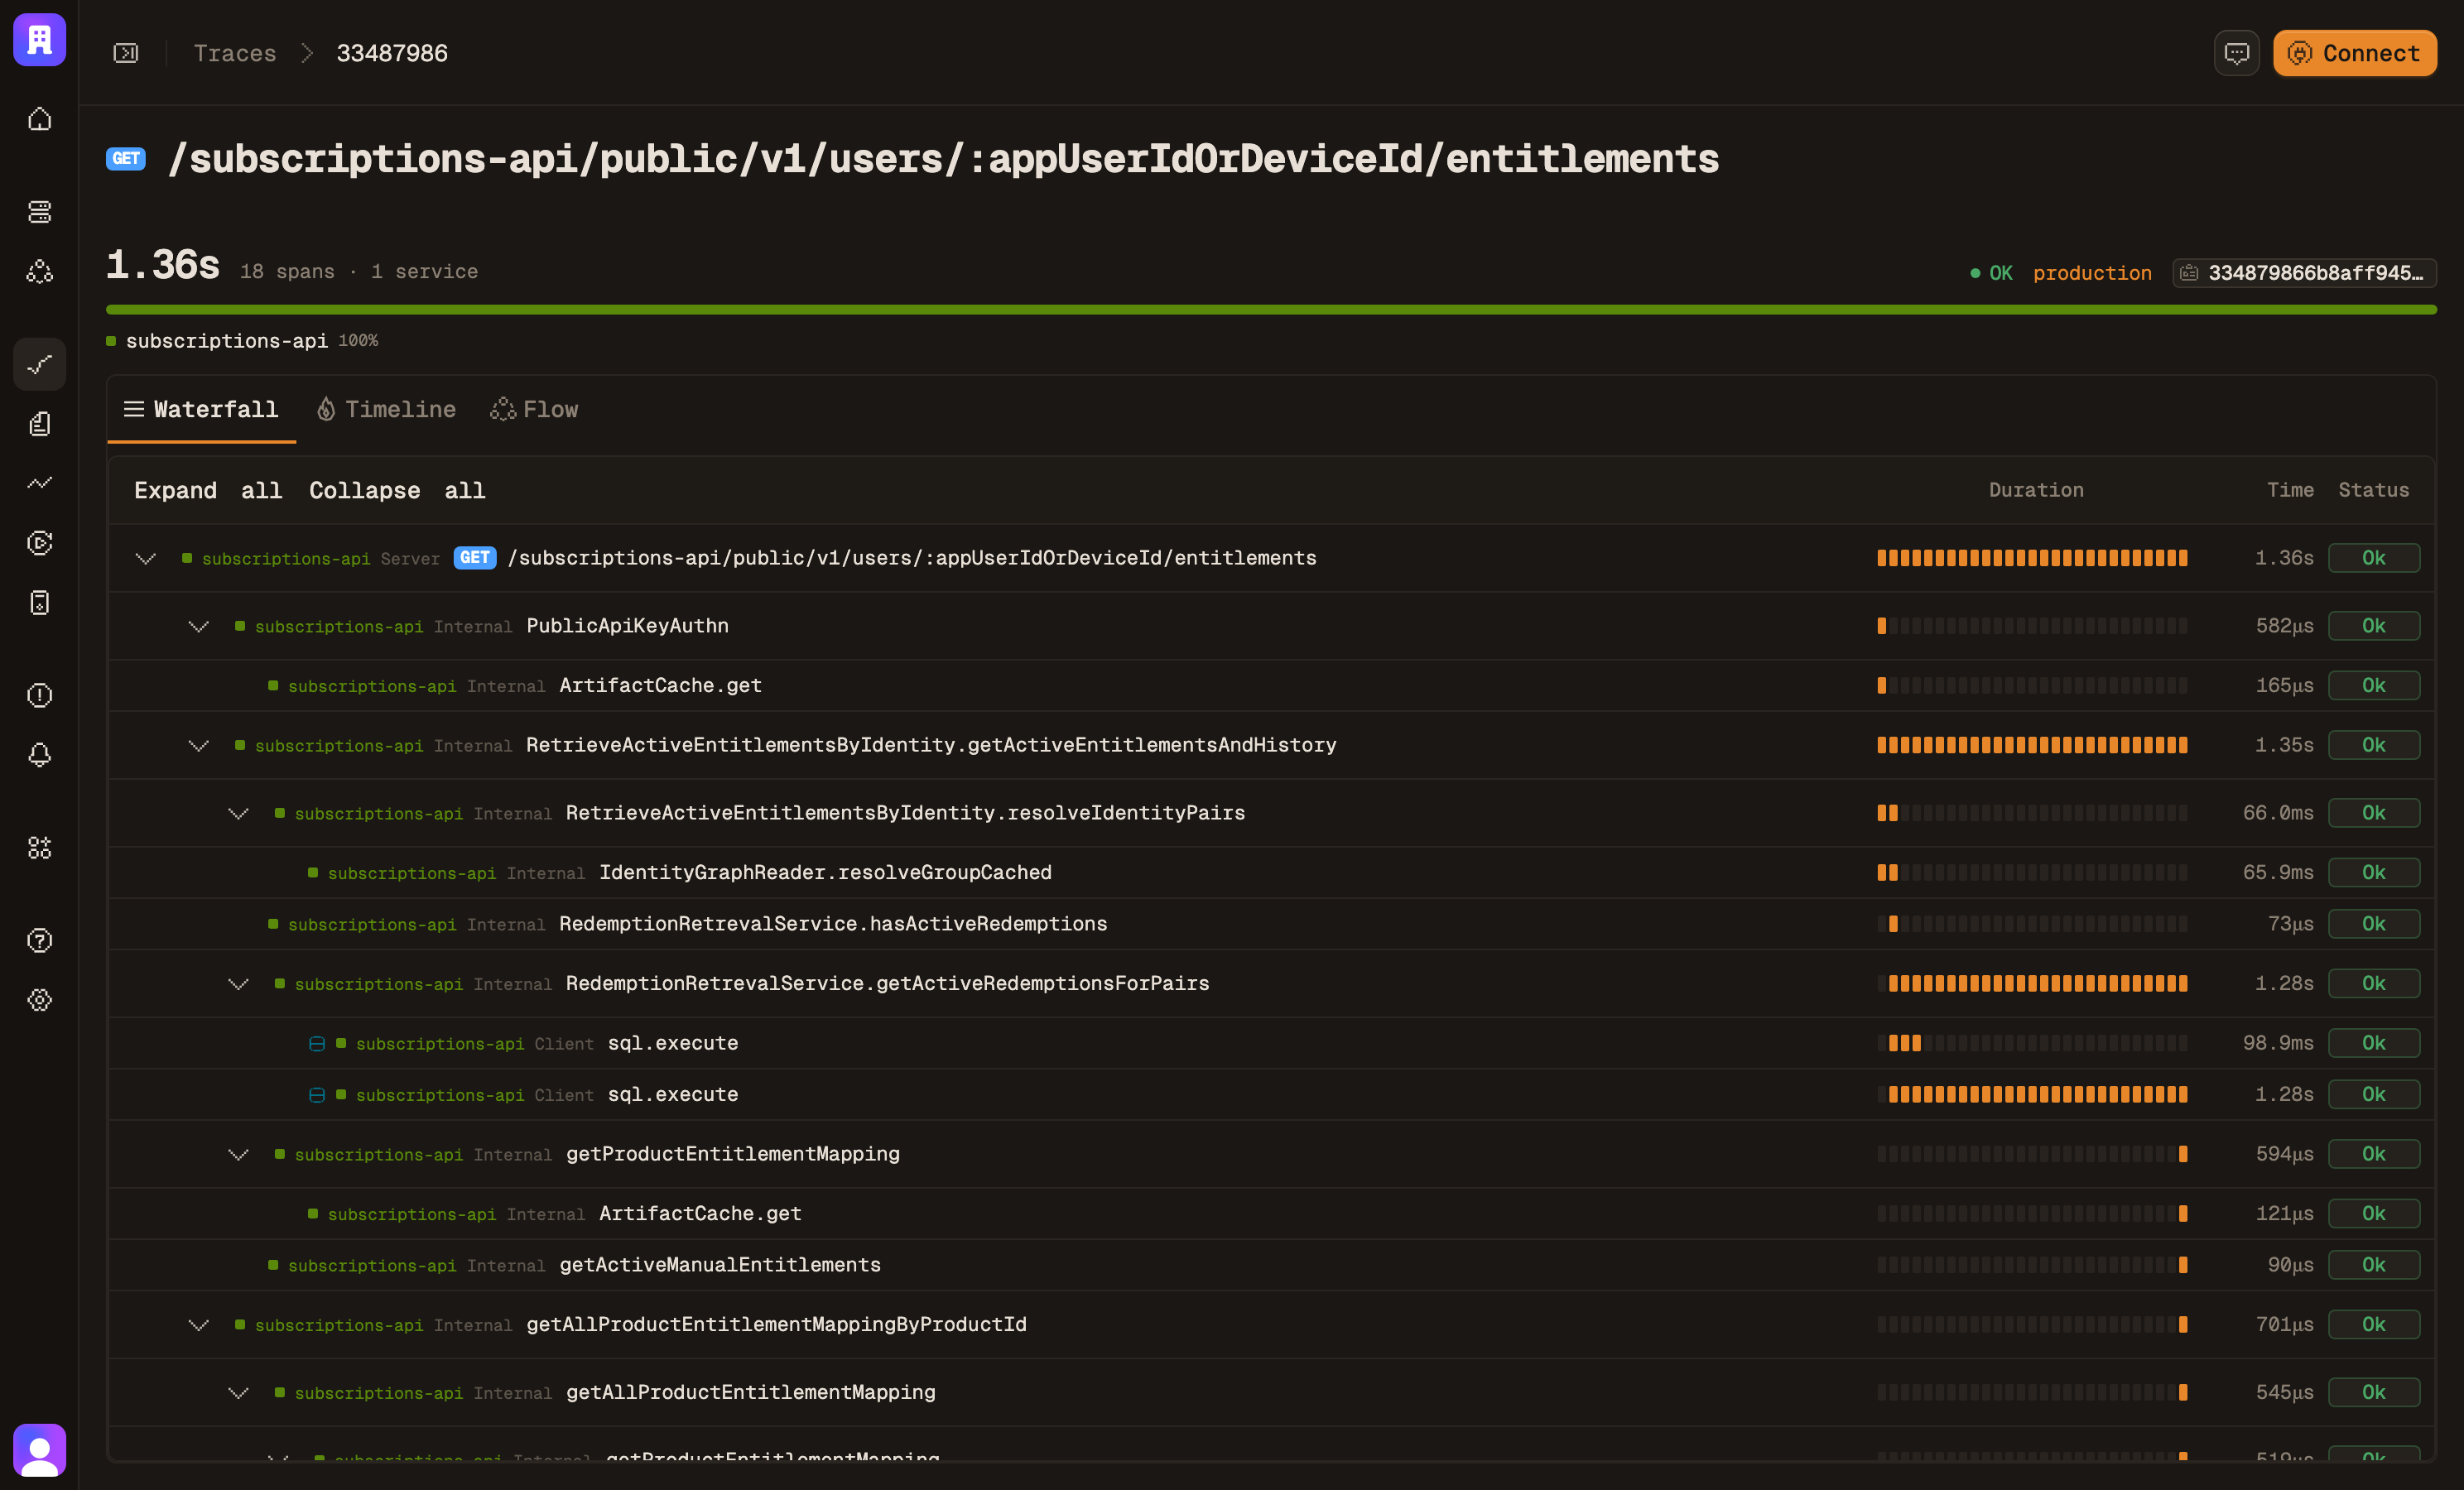
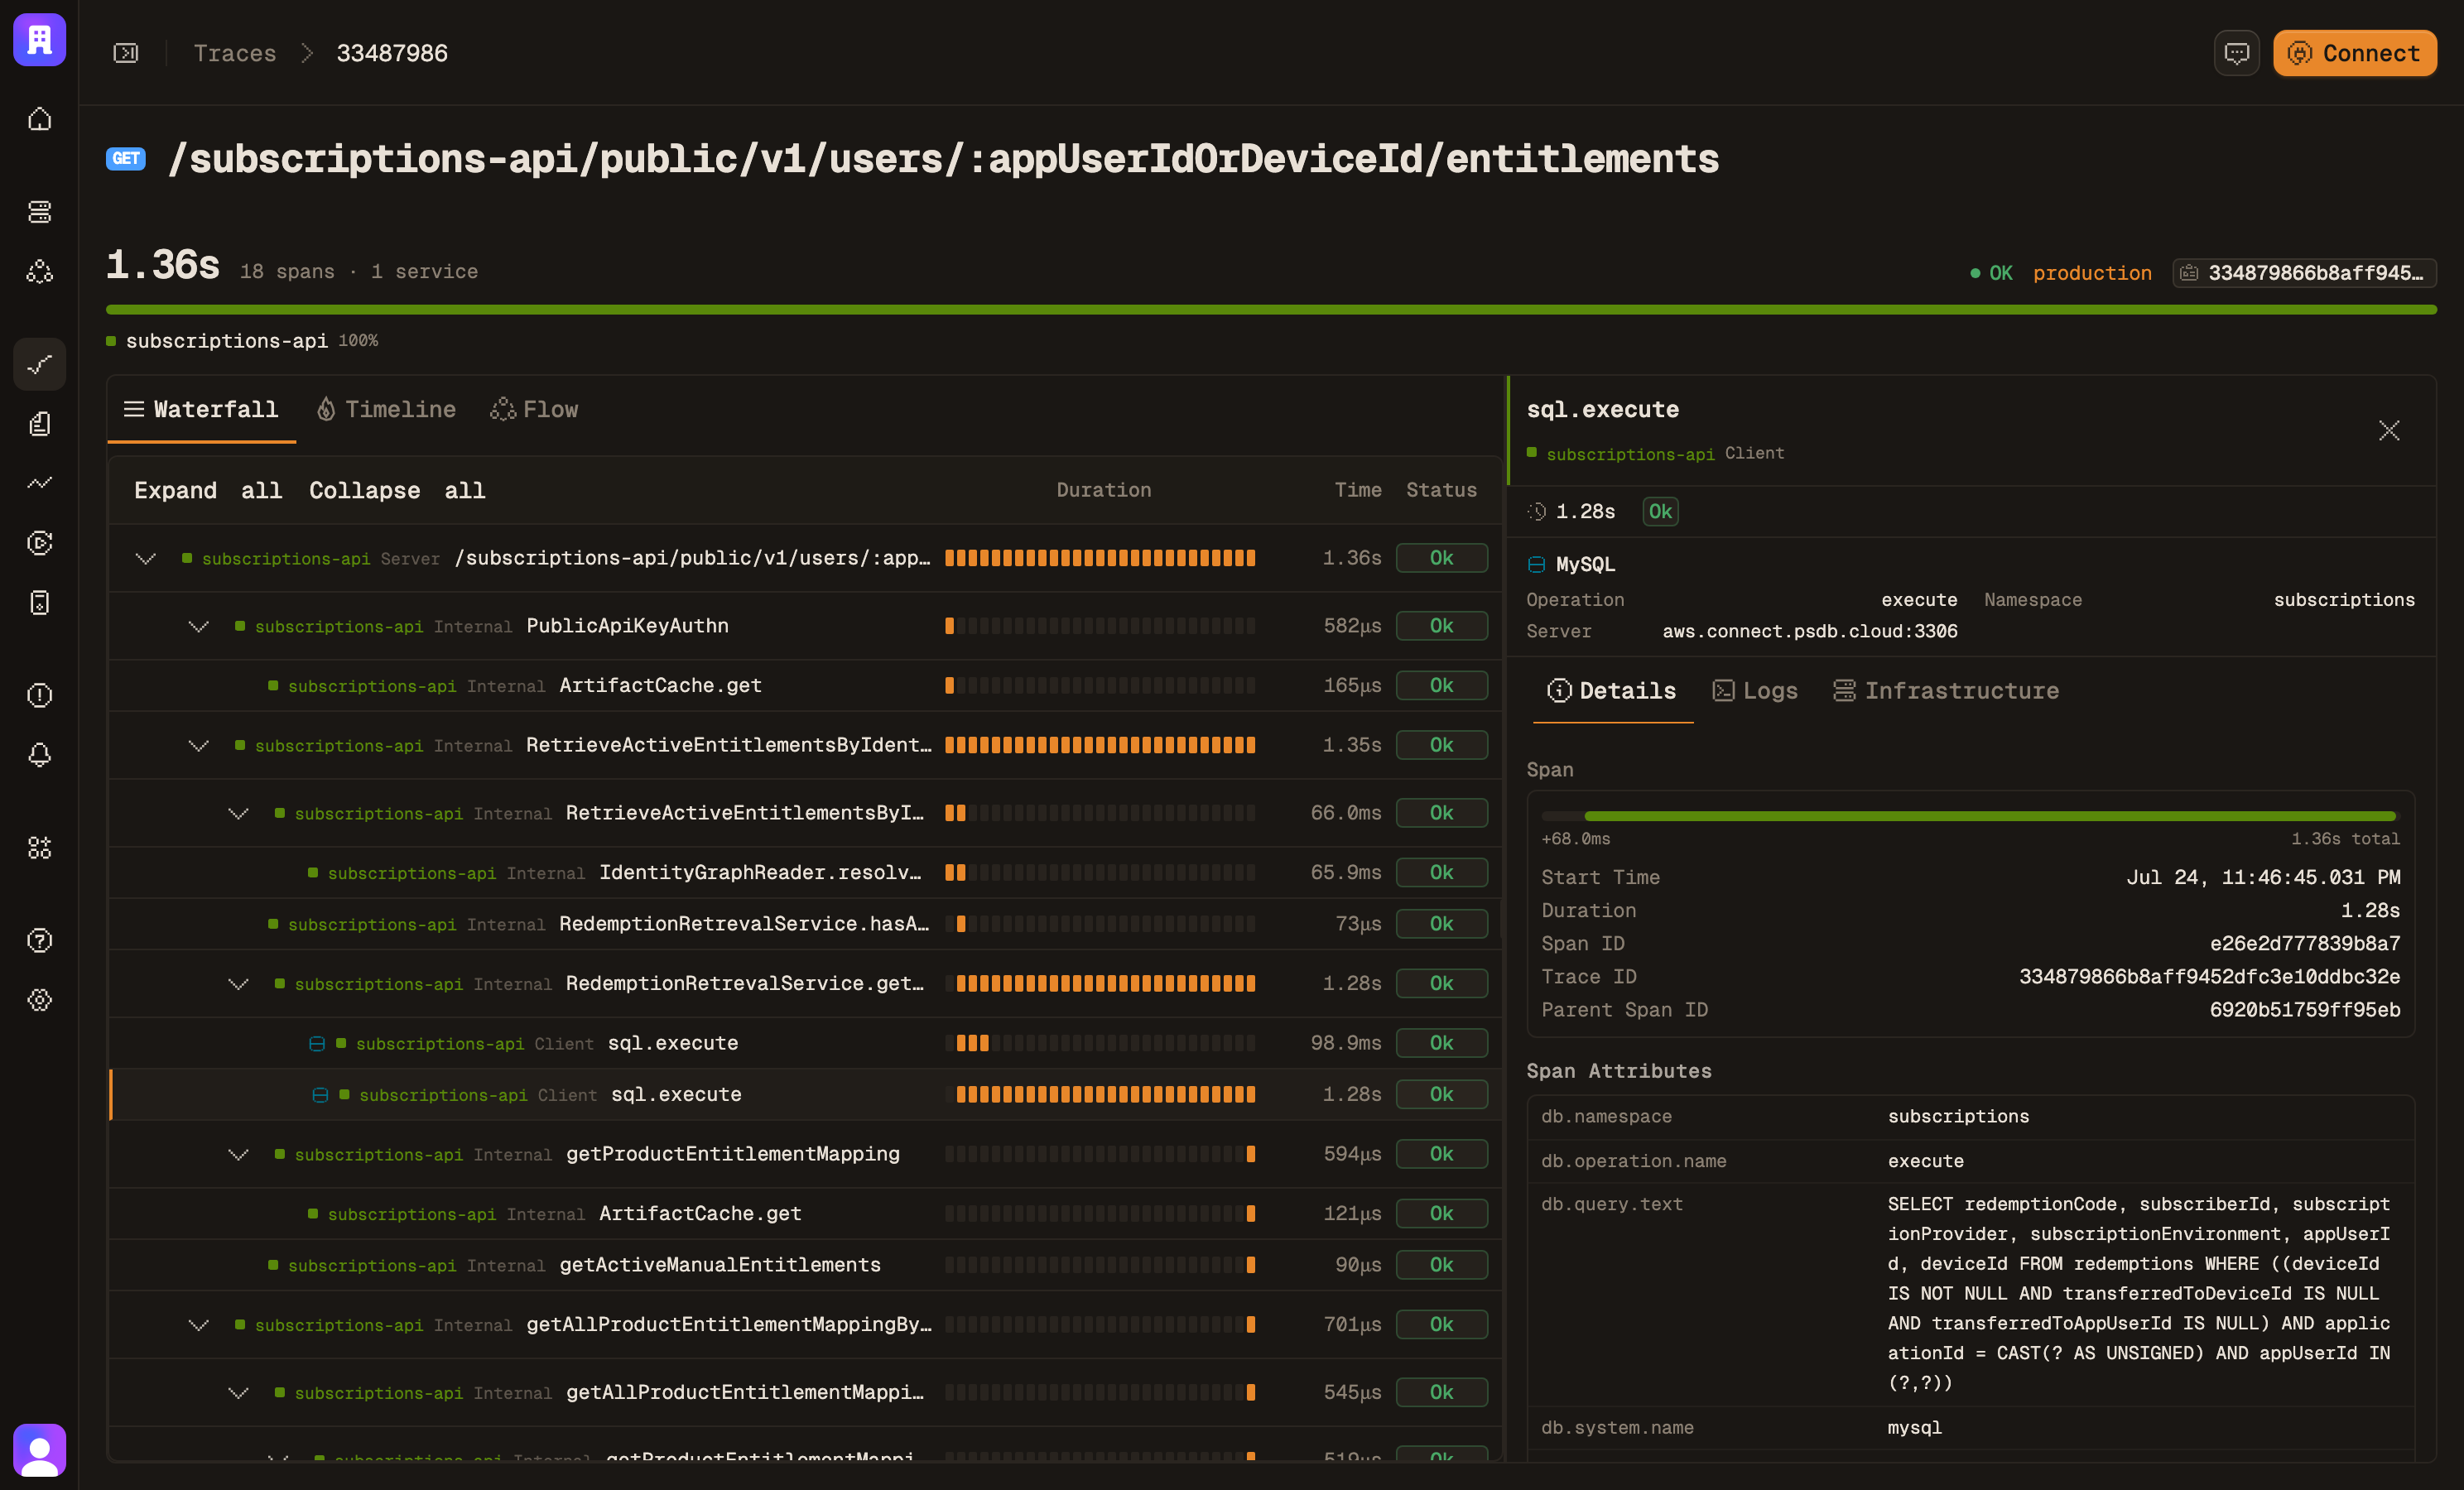
Read the trace.
Every request as a span tree, attributes intact. Click a span and see what it carried.
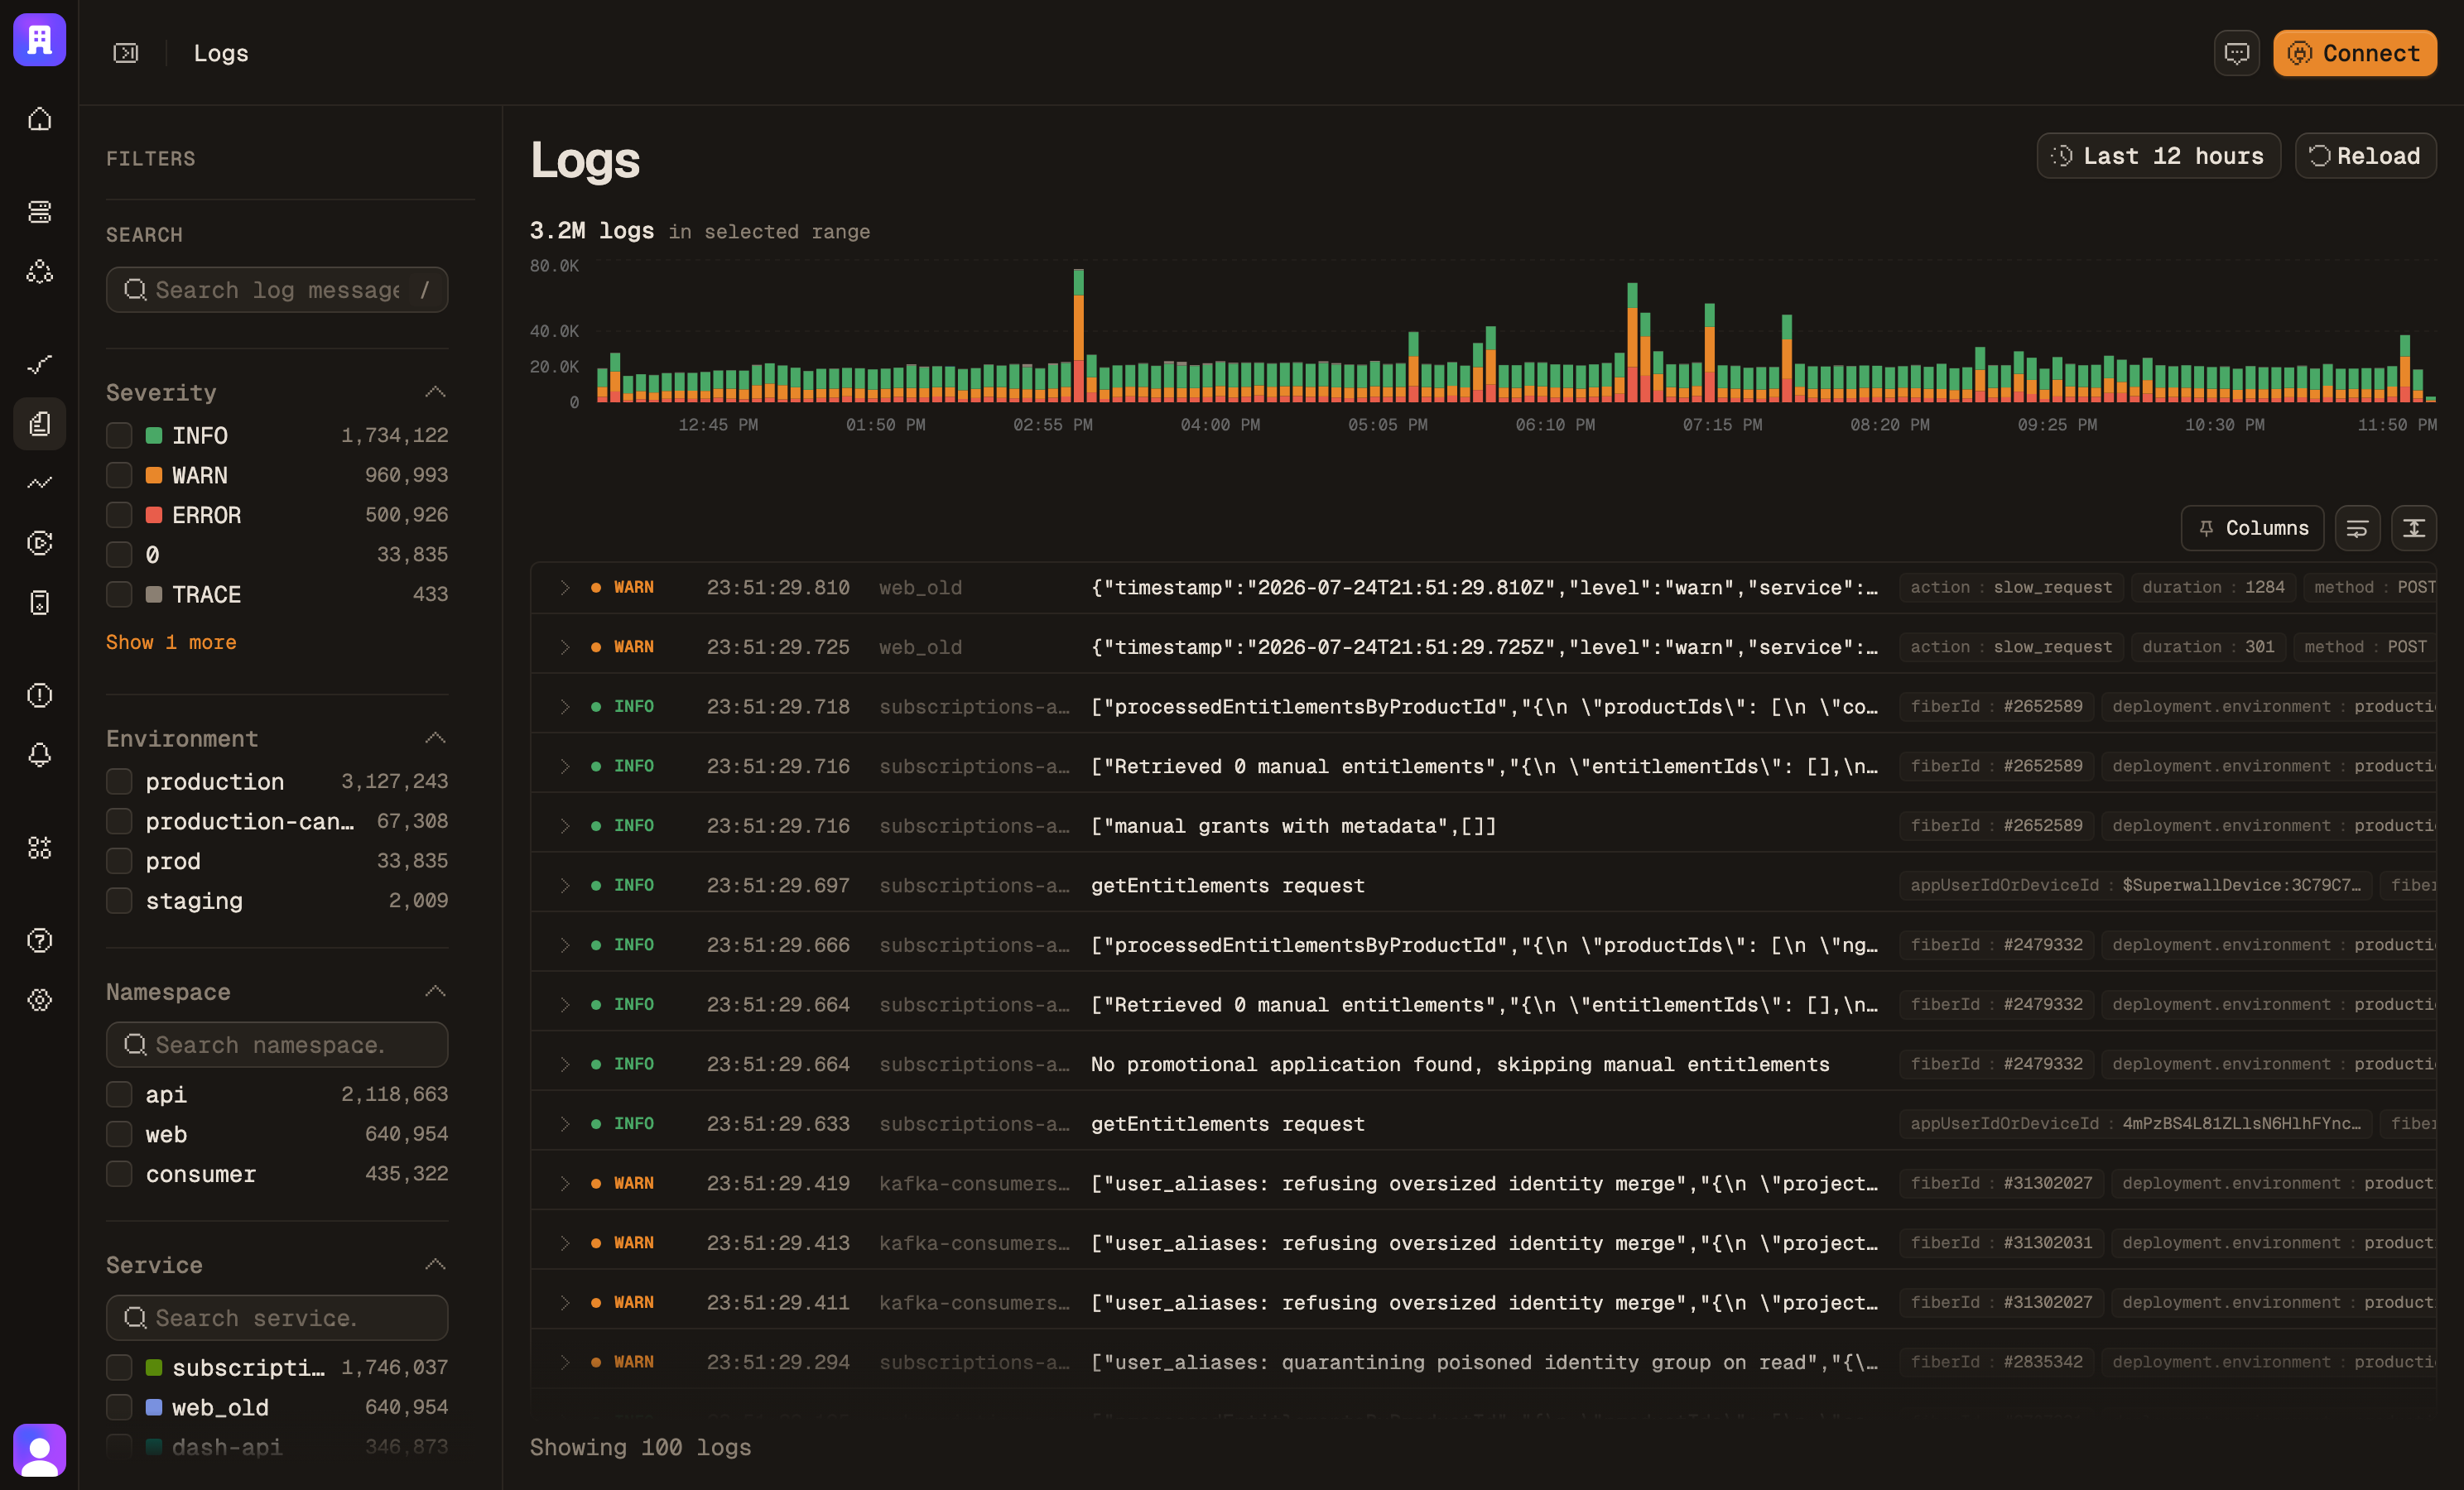
Search the logs.
Structured logs straight from OTLP. Filter by severity, service, or any attribute, then jump to the trace.
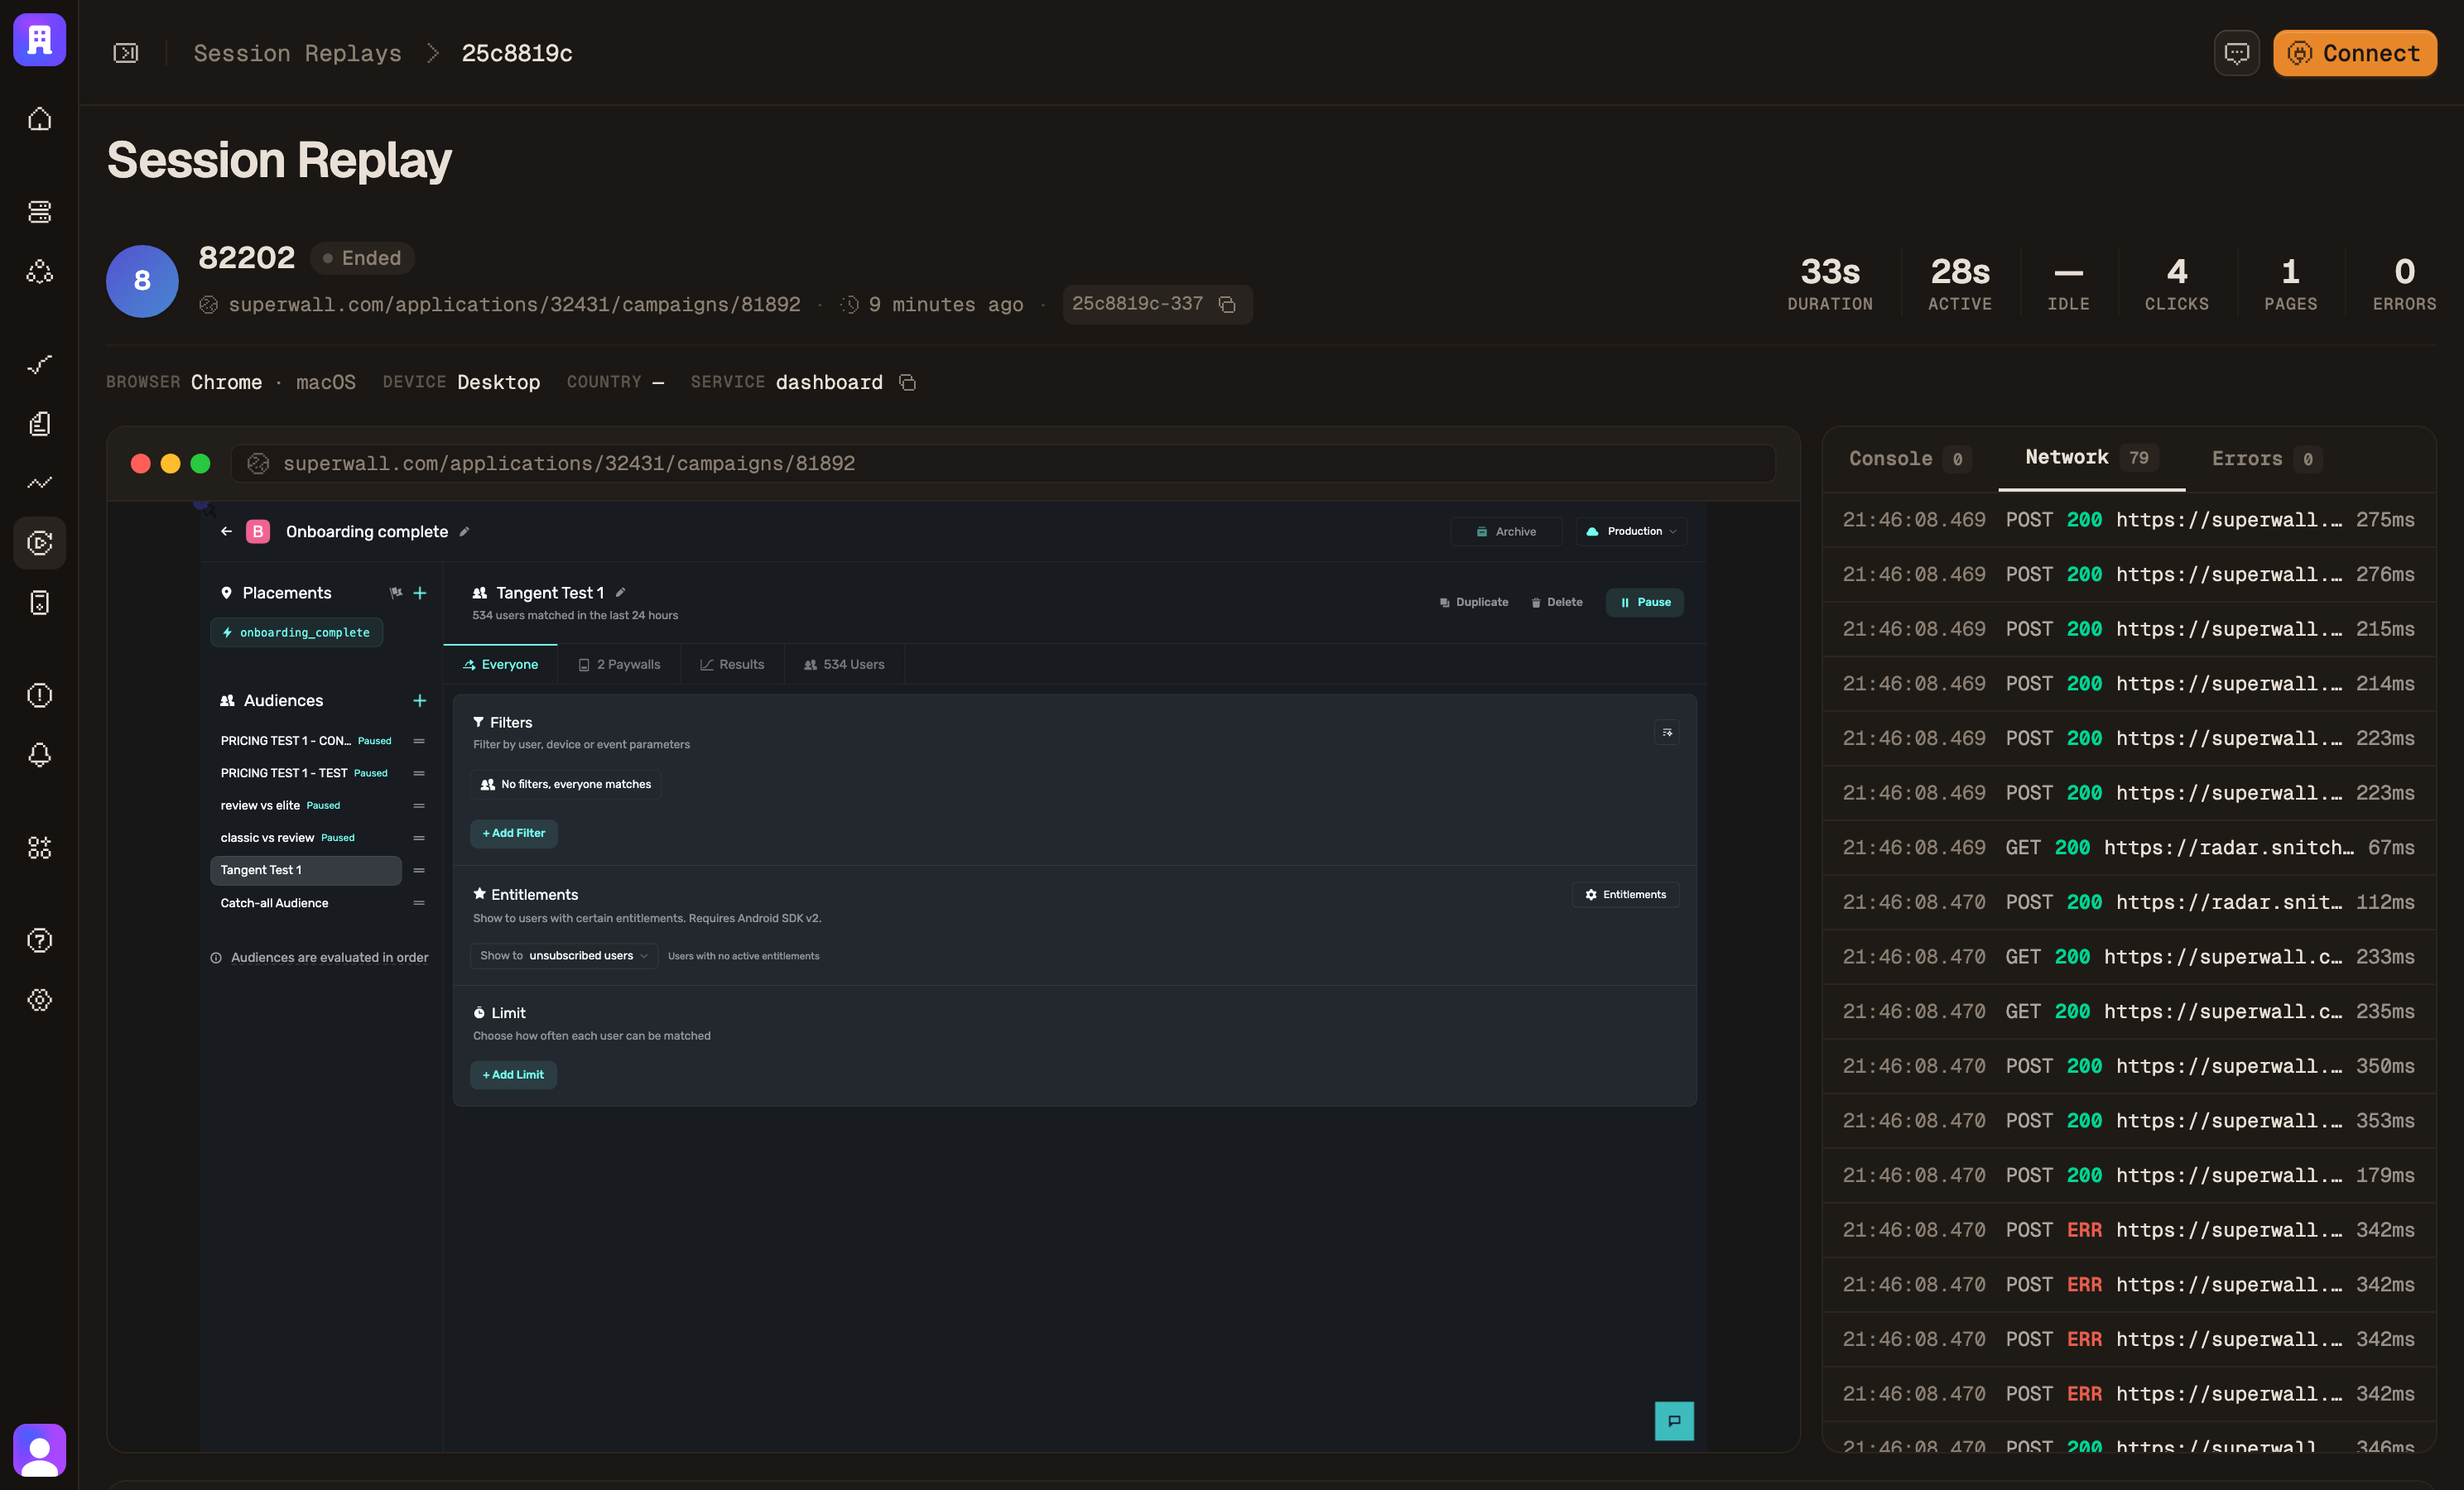
Replay the session.
Every click, route, console line, and failed request. Replay and spans share one session id.
02 · Incident
From a 3 AM page to the line that caused it.
Four surfaces, one trace id. Every step below opens from the one before it.
- alert trace 4f9ac21e…8b7d40f2
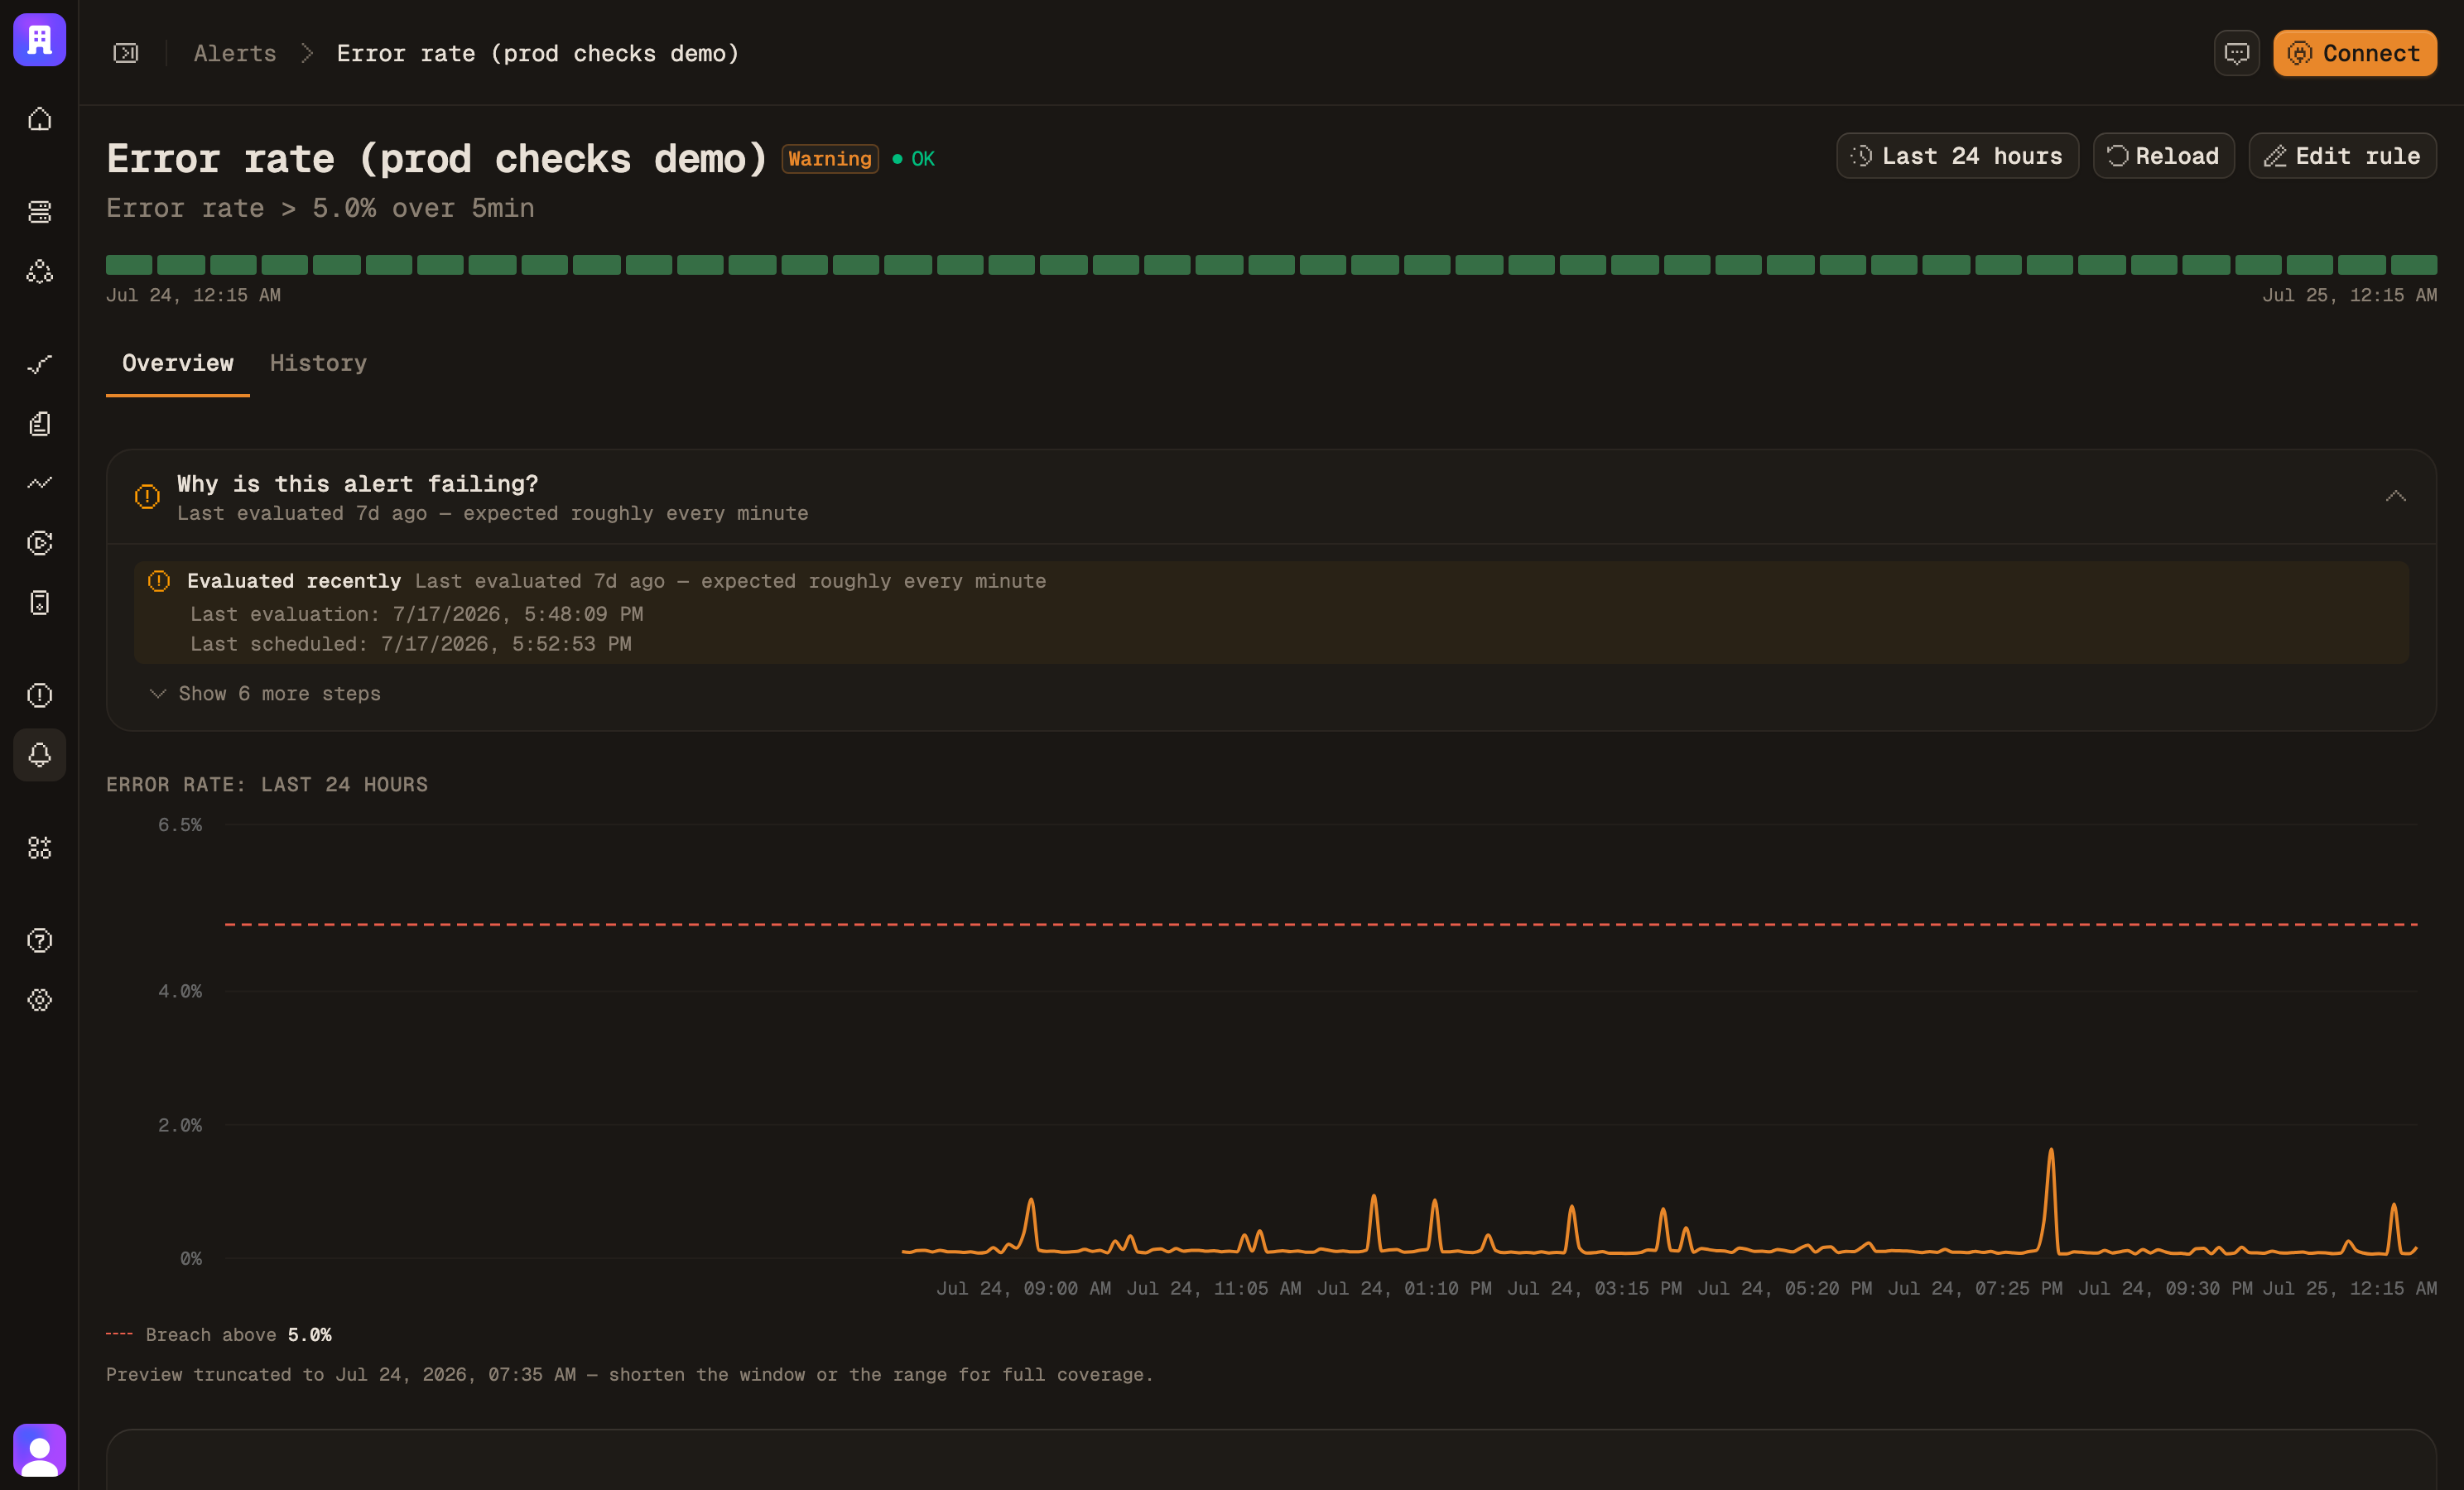
The alert arrives with context.
Error rate on api-gateway crosses 5%. The alert carries the service, the threshold it broke and the spans that failed. Route it to Slack, Discord, Telegram, PagerDuty, email, or any webhook.
- trace trace 4f9ac21e…8b7d40f2
The trace opens on the failing span.
The failing request is a span tree with every attribute intact. Three Stripe retries sit at the bottom, red, each timing out at exactly 1.75 seconds.
- logs trace 4f9ac21e…8b7d40f2
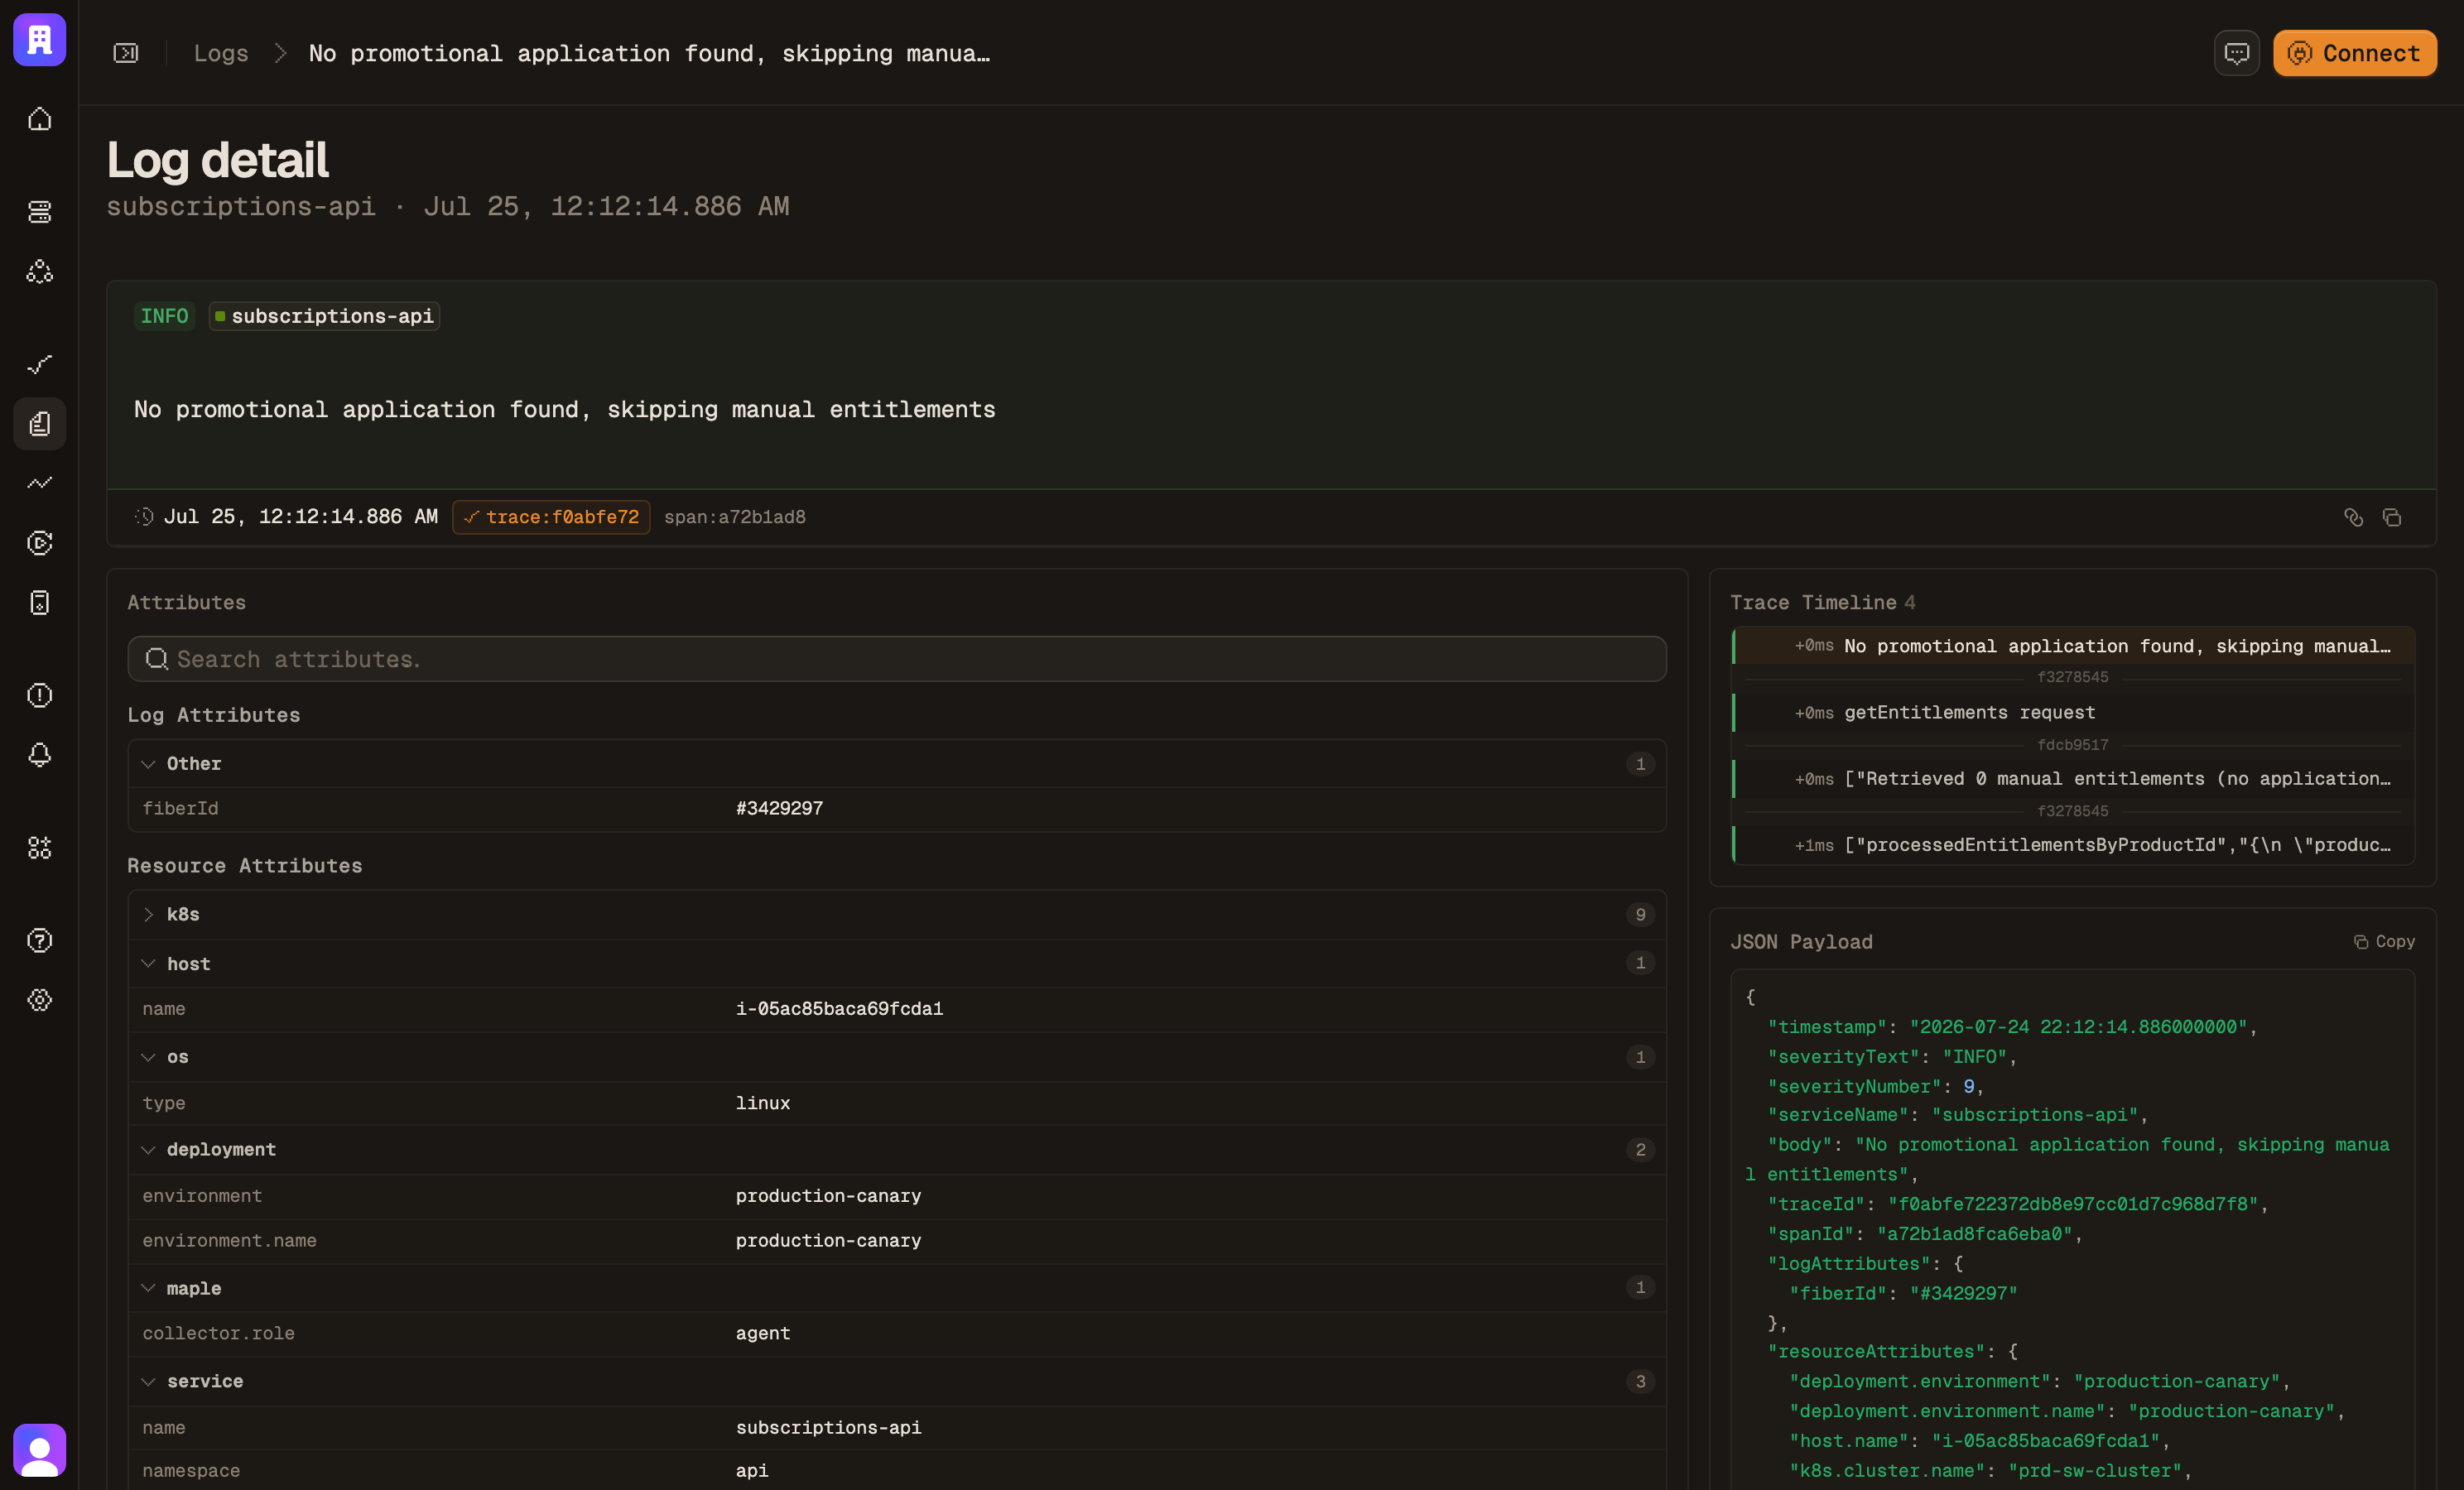
The logs are already correlated.
Jump from the failing span to its logs on the trace id. Retry exhaustion, connection pool at 20/20. The confirmation is on the same screen.
- agent trace 4f9ac21e…8b7d40f2
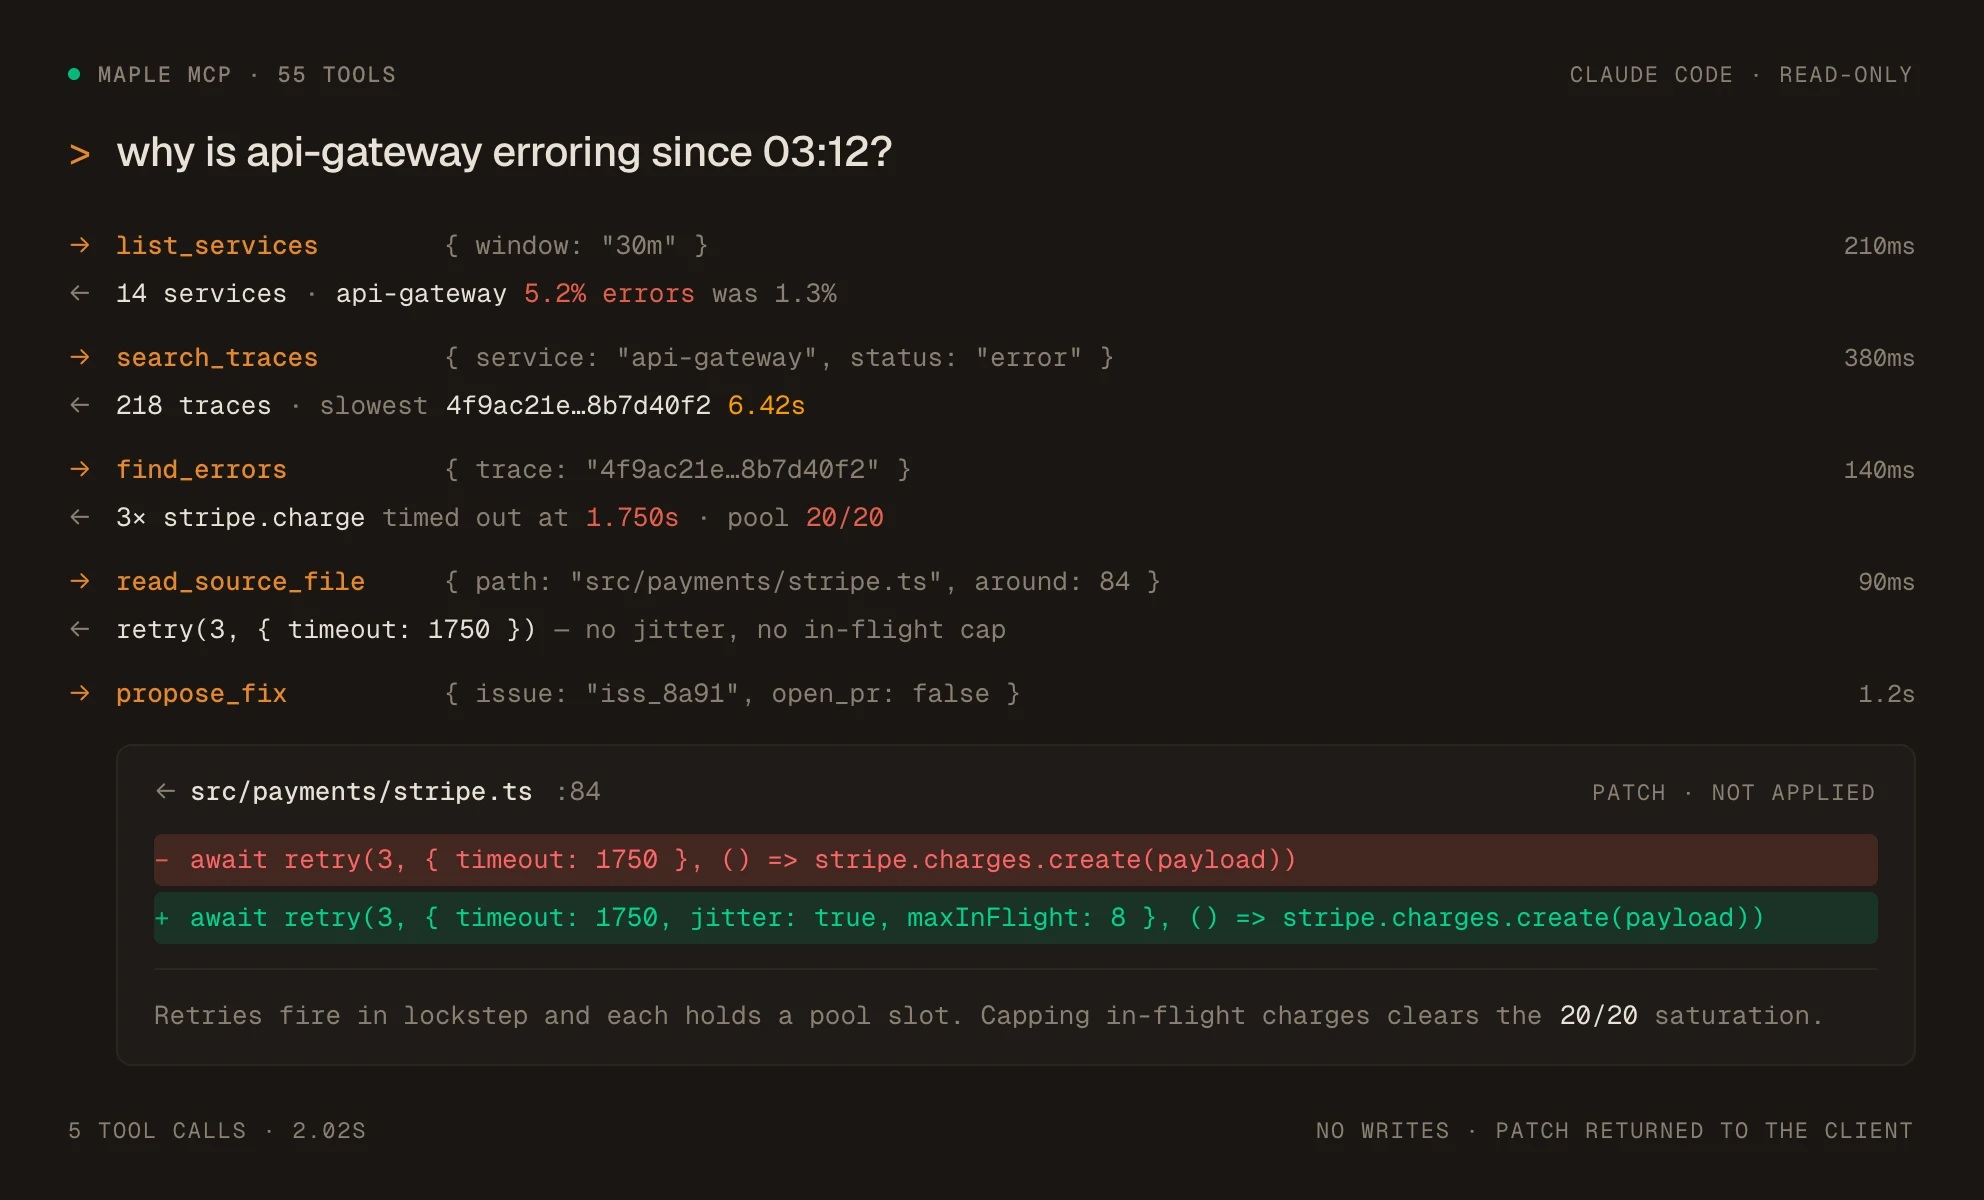
Or hand it to an agent.
Point Claude, Cursor, or any MCP client at Maple. It lists services, searches traces, reads the source, and proposes the fix.
03 · Local
Maple on your laptop, as one binary.
One maple executable runs OTLP ingest, an embedded database, the query API and the dashboard on 127.0.0.1. No account and no cloud.
$ brew install Makisuo/tap/maple or curl -fsSL https://maple.dev/cli/install | sh
04 · Platform
Everything else you'd have bought separately.
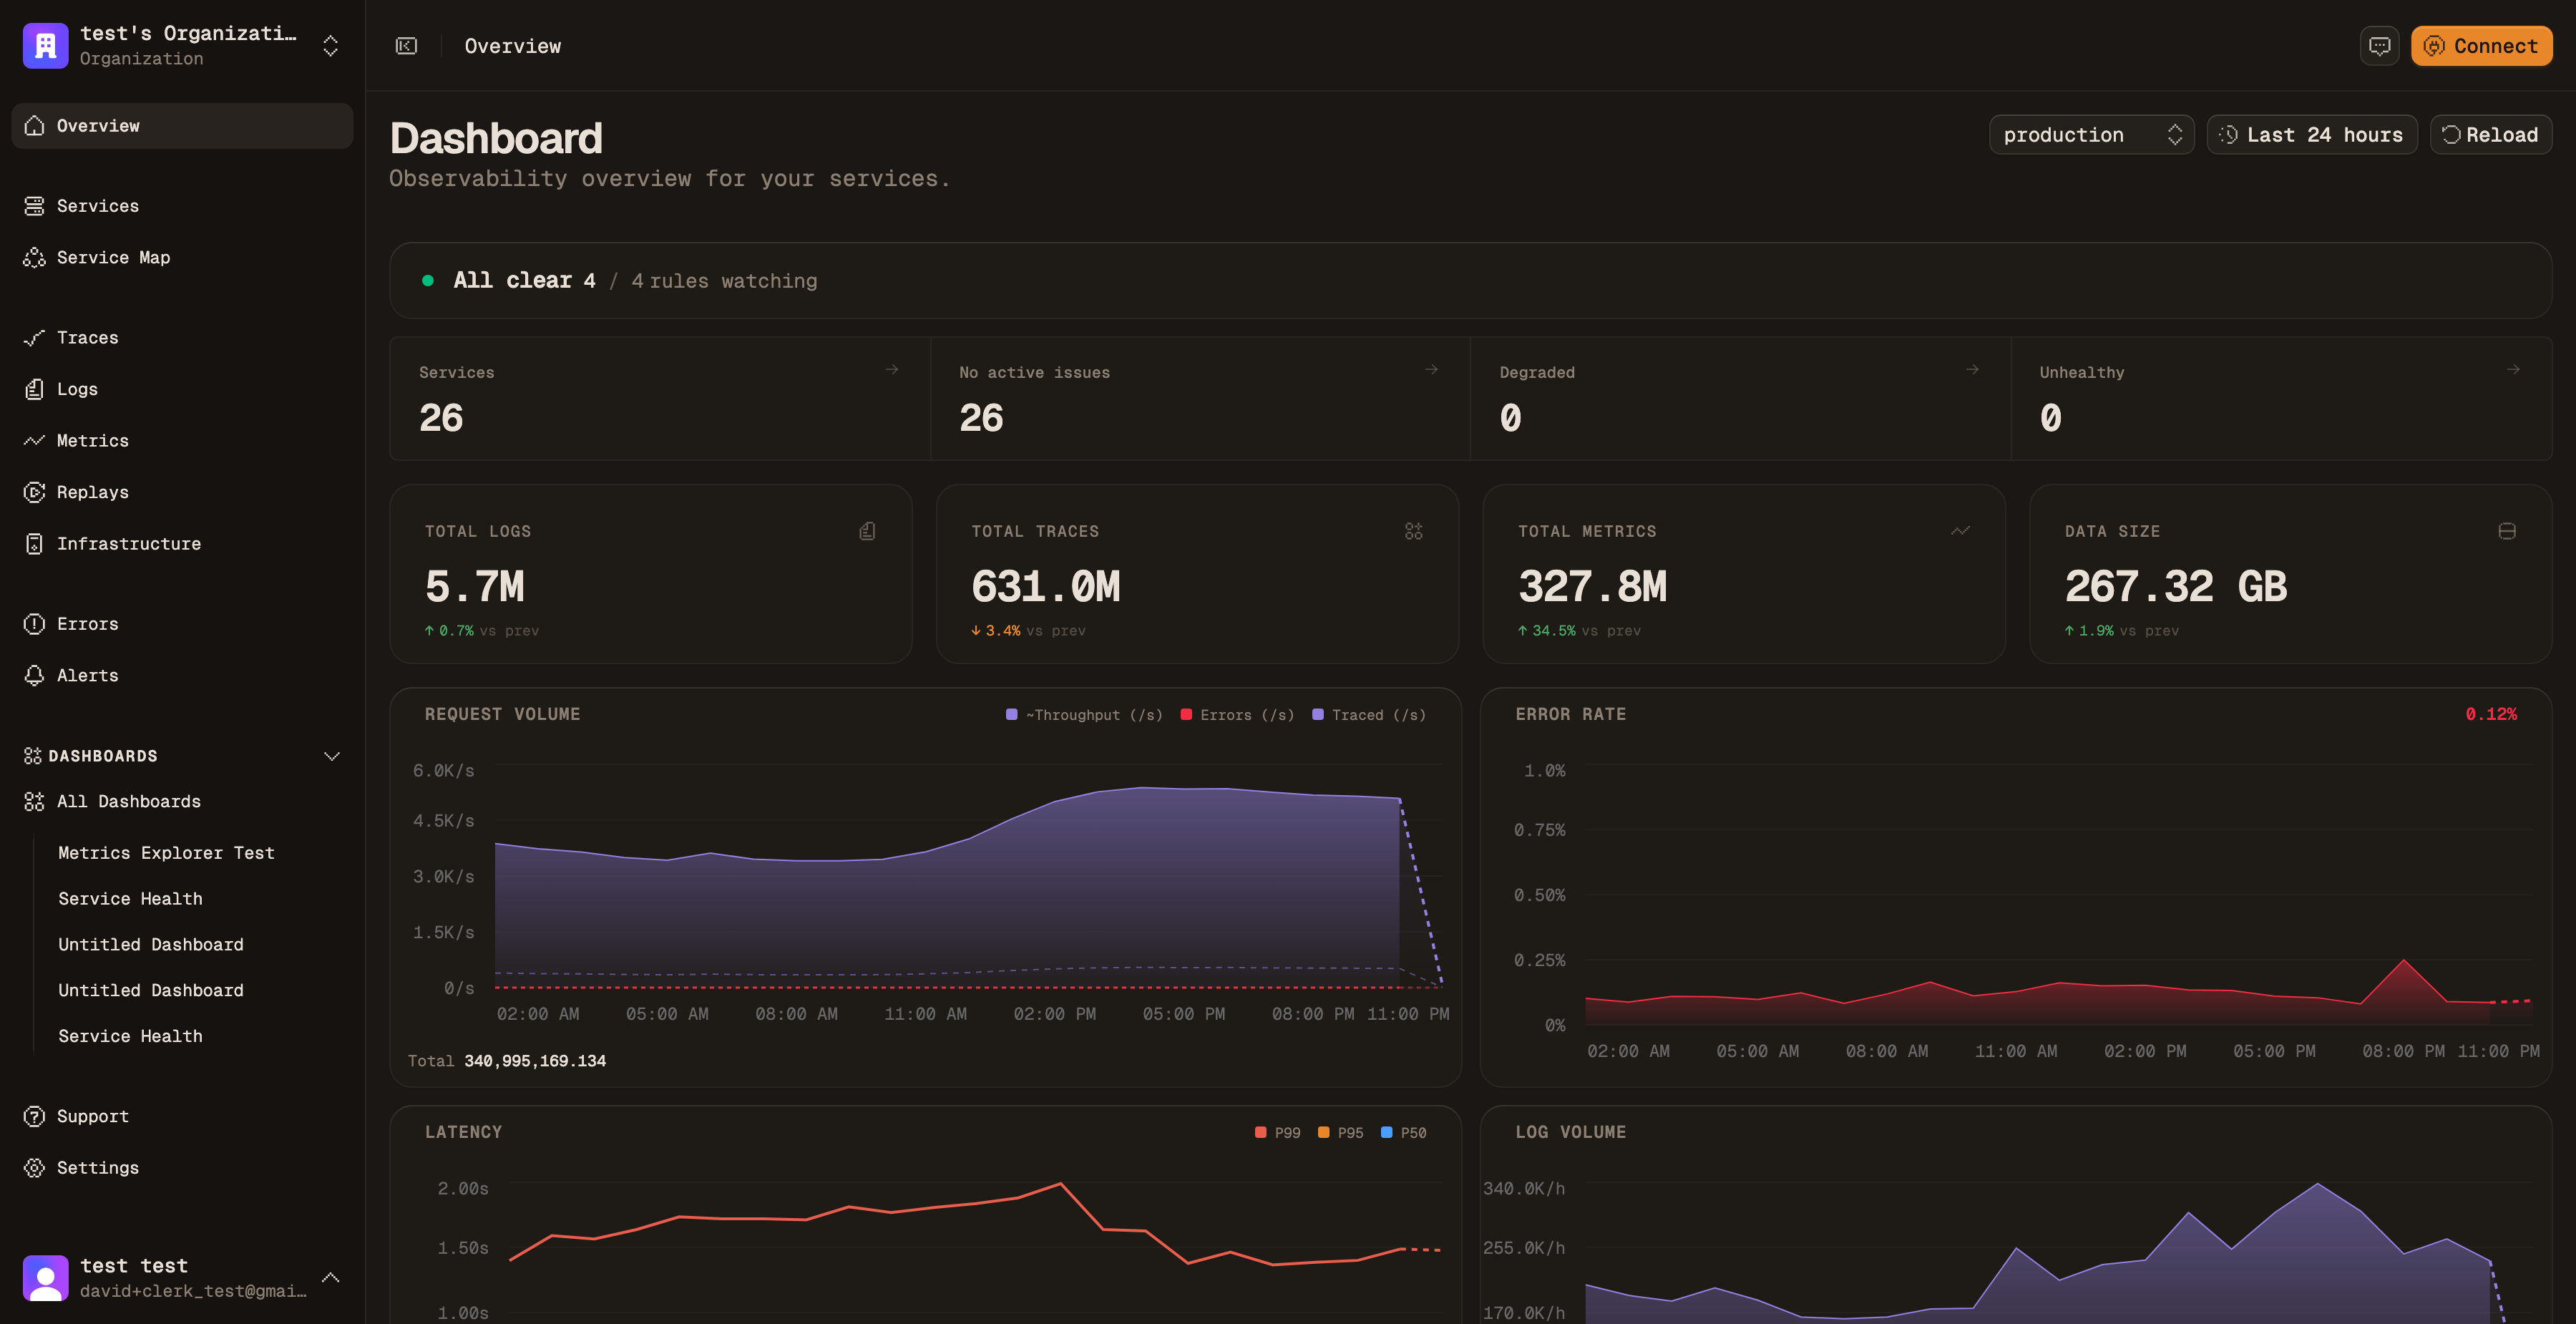
Metrics, service maps, error grouping, alerting, and an MCP server, all on the instrumentation you already send.
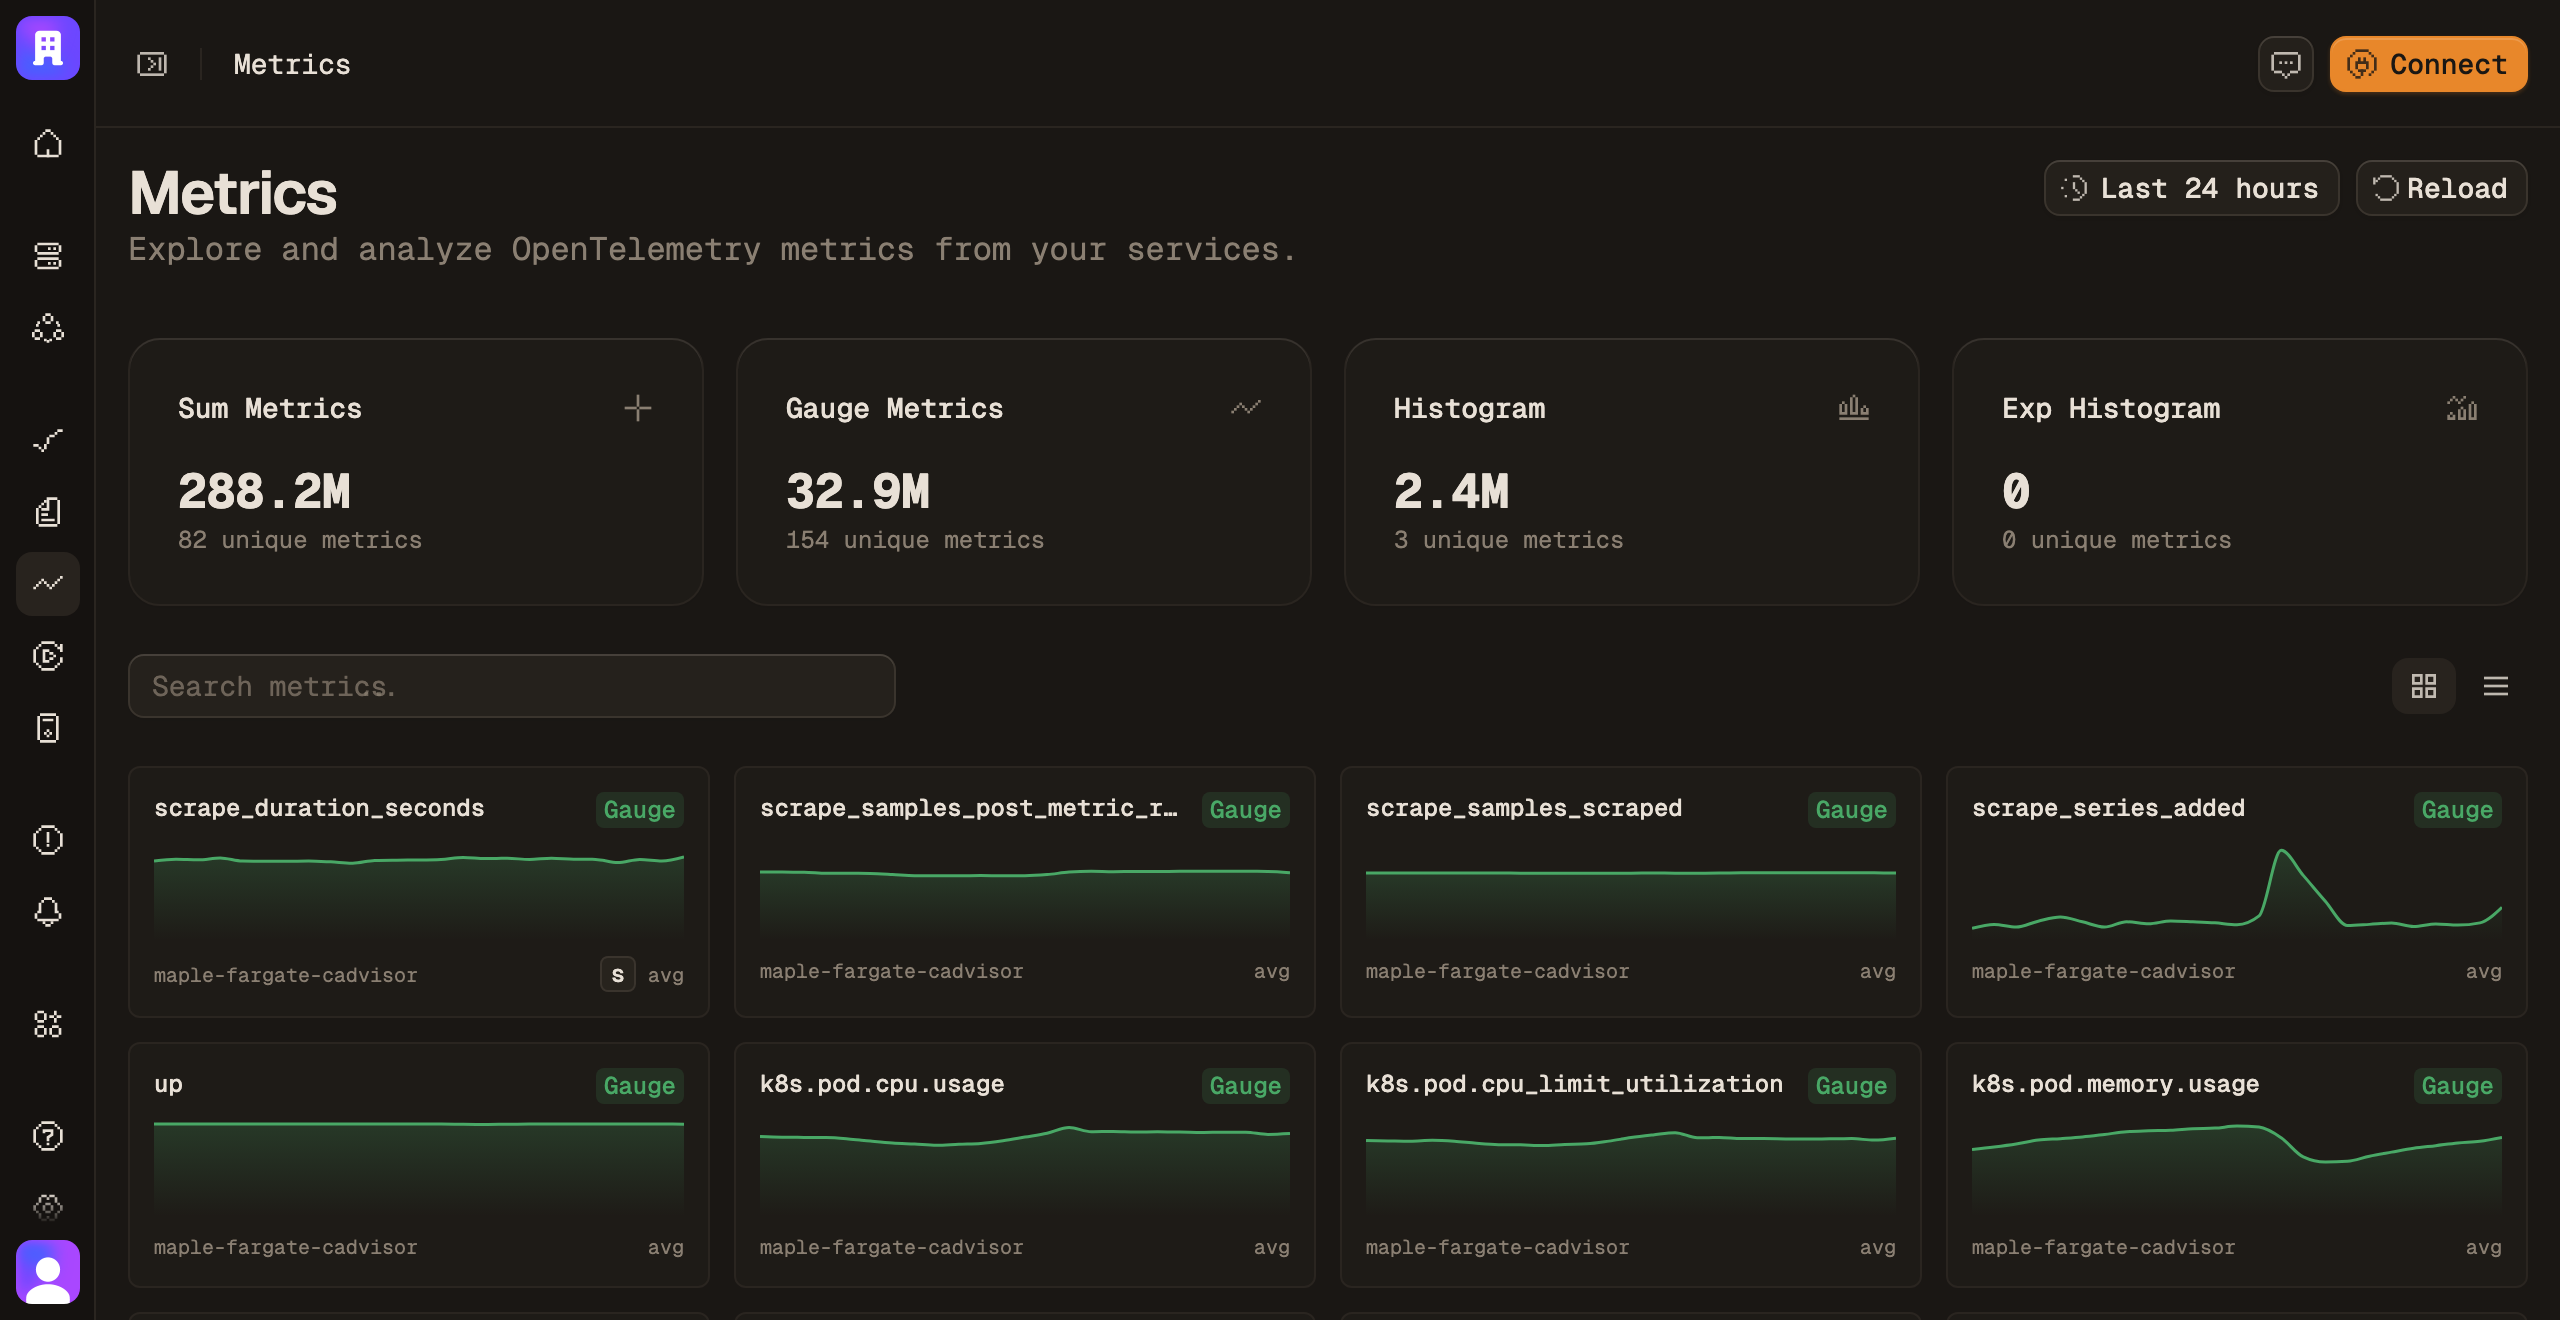
Metrics & dashboards
Request rate, error rate, latency percentiles. Build the board yourself, or ask the agent to build it.
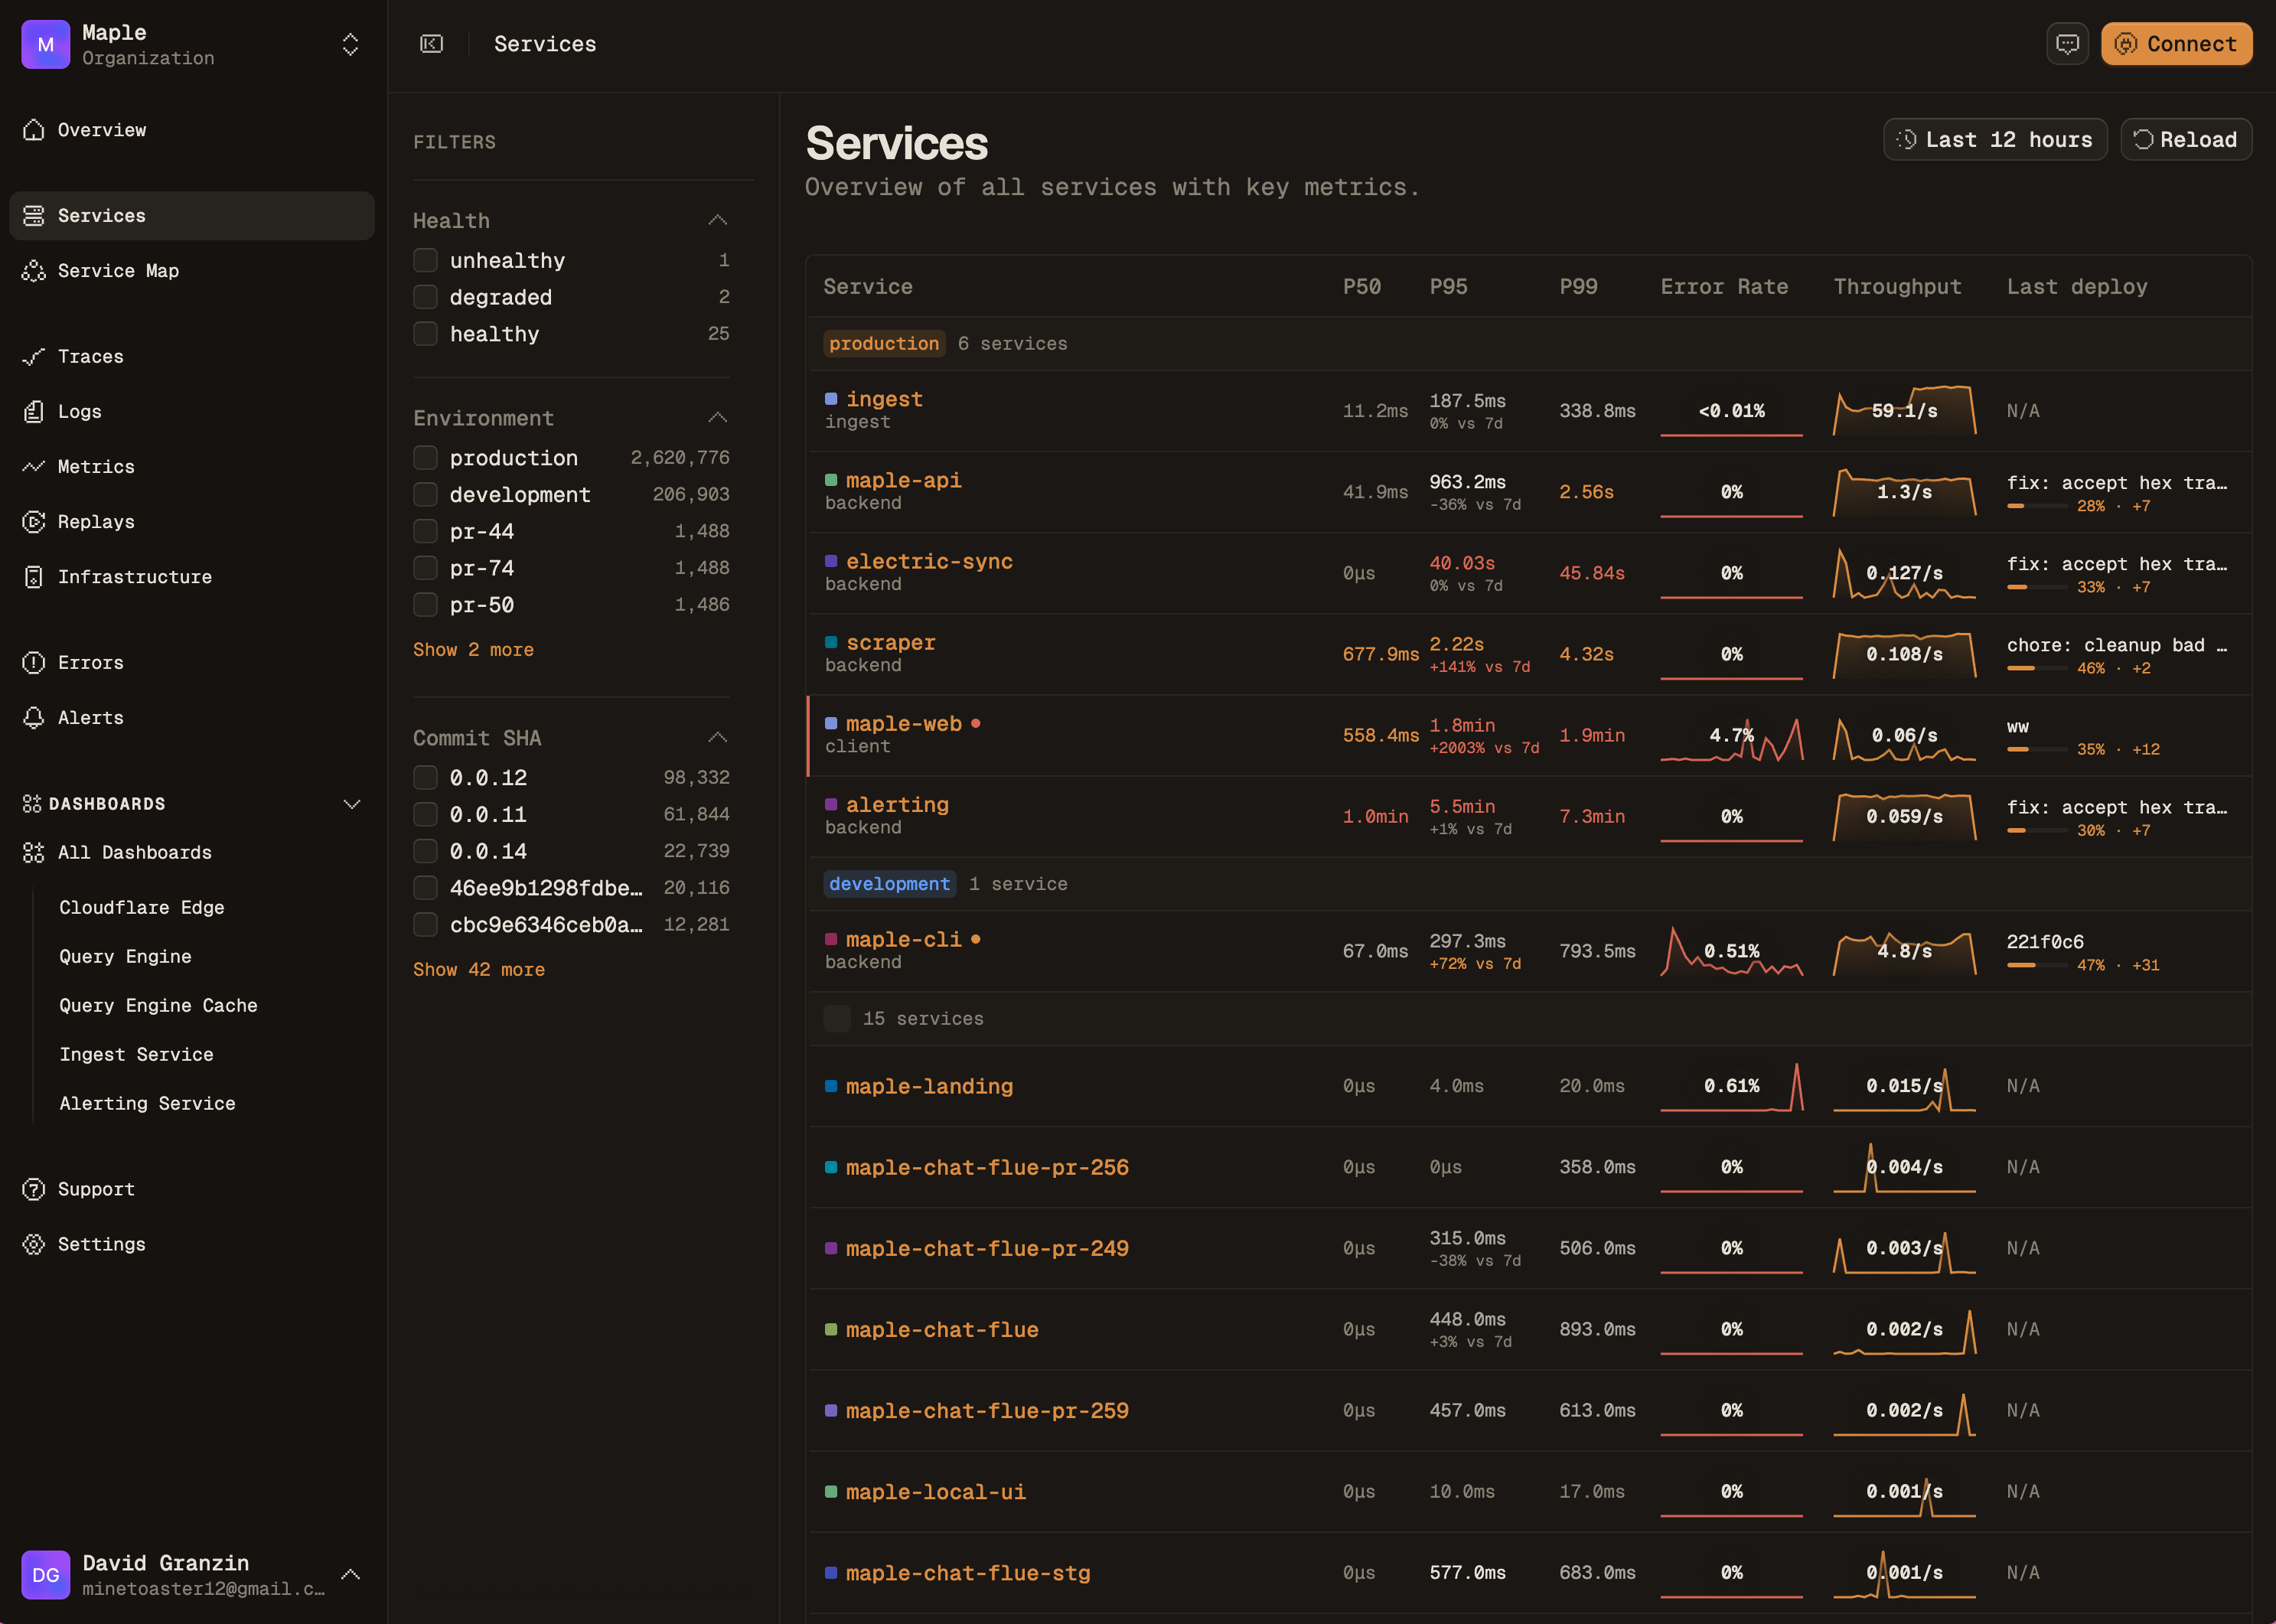
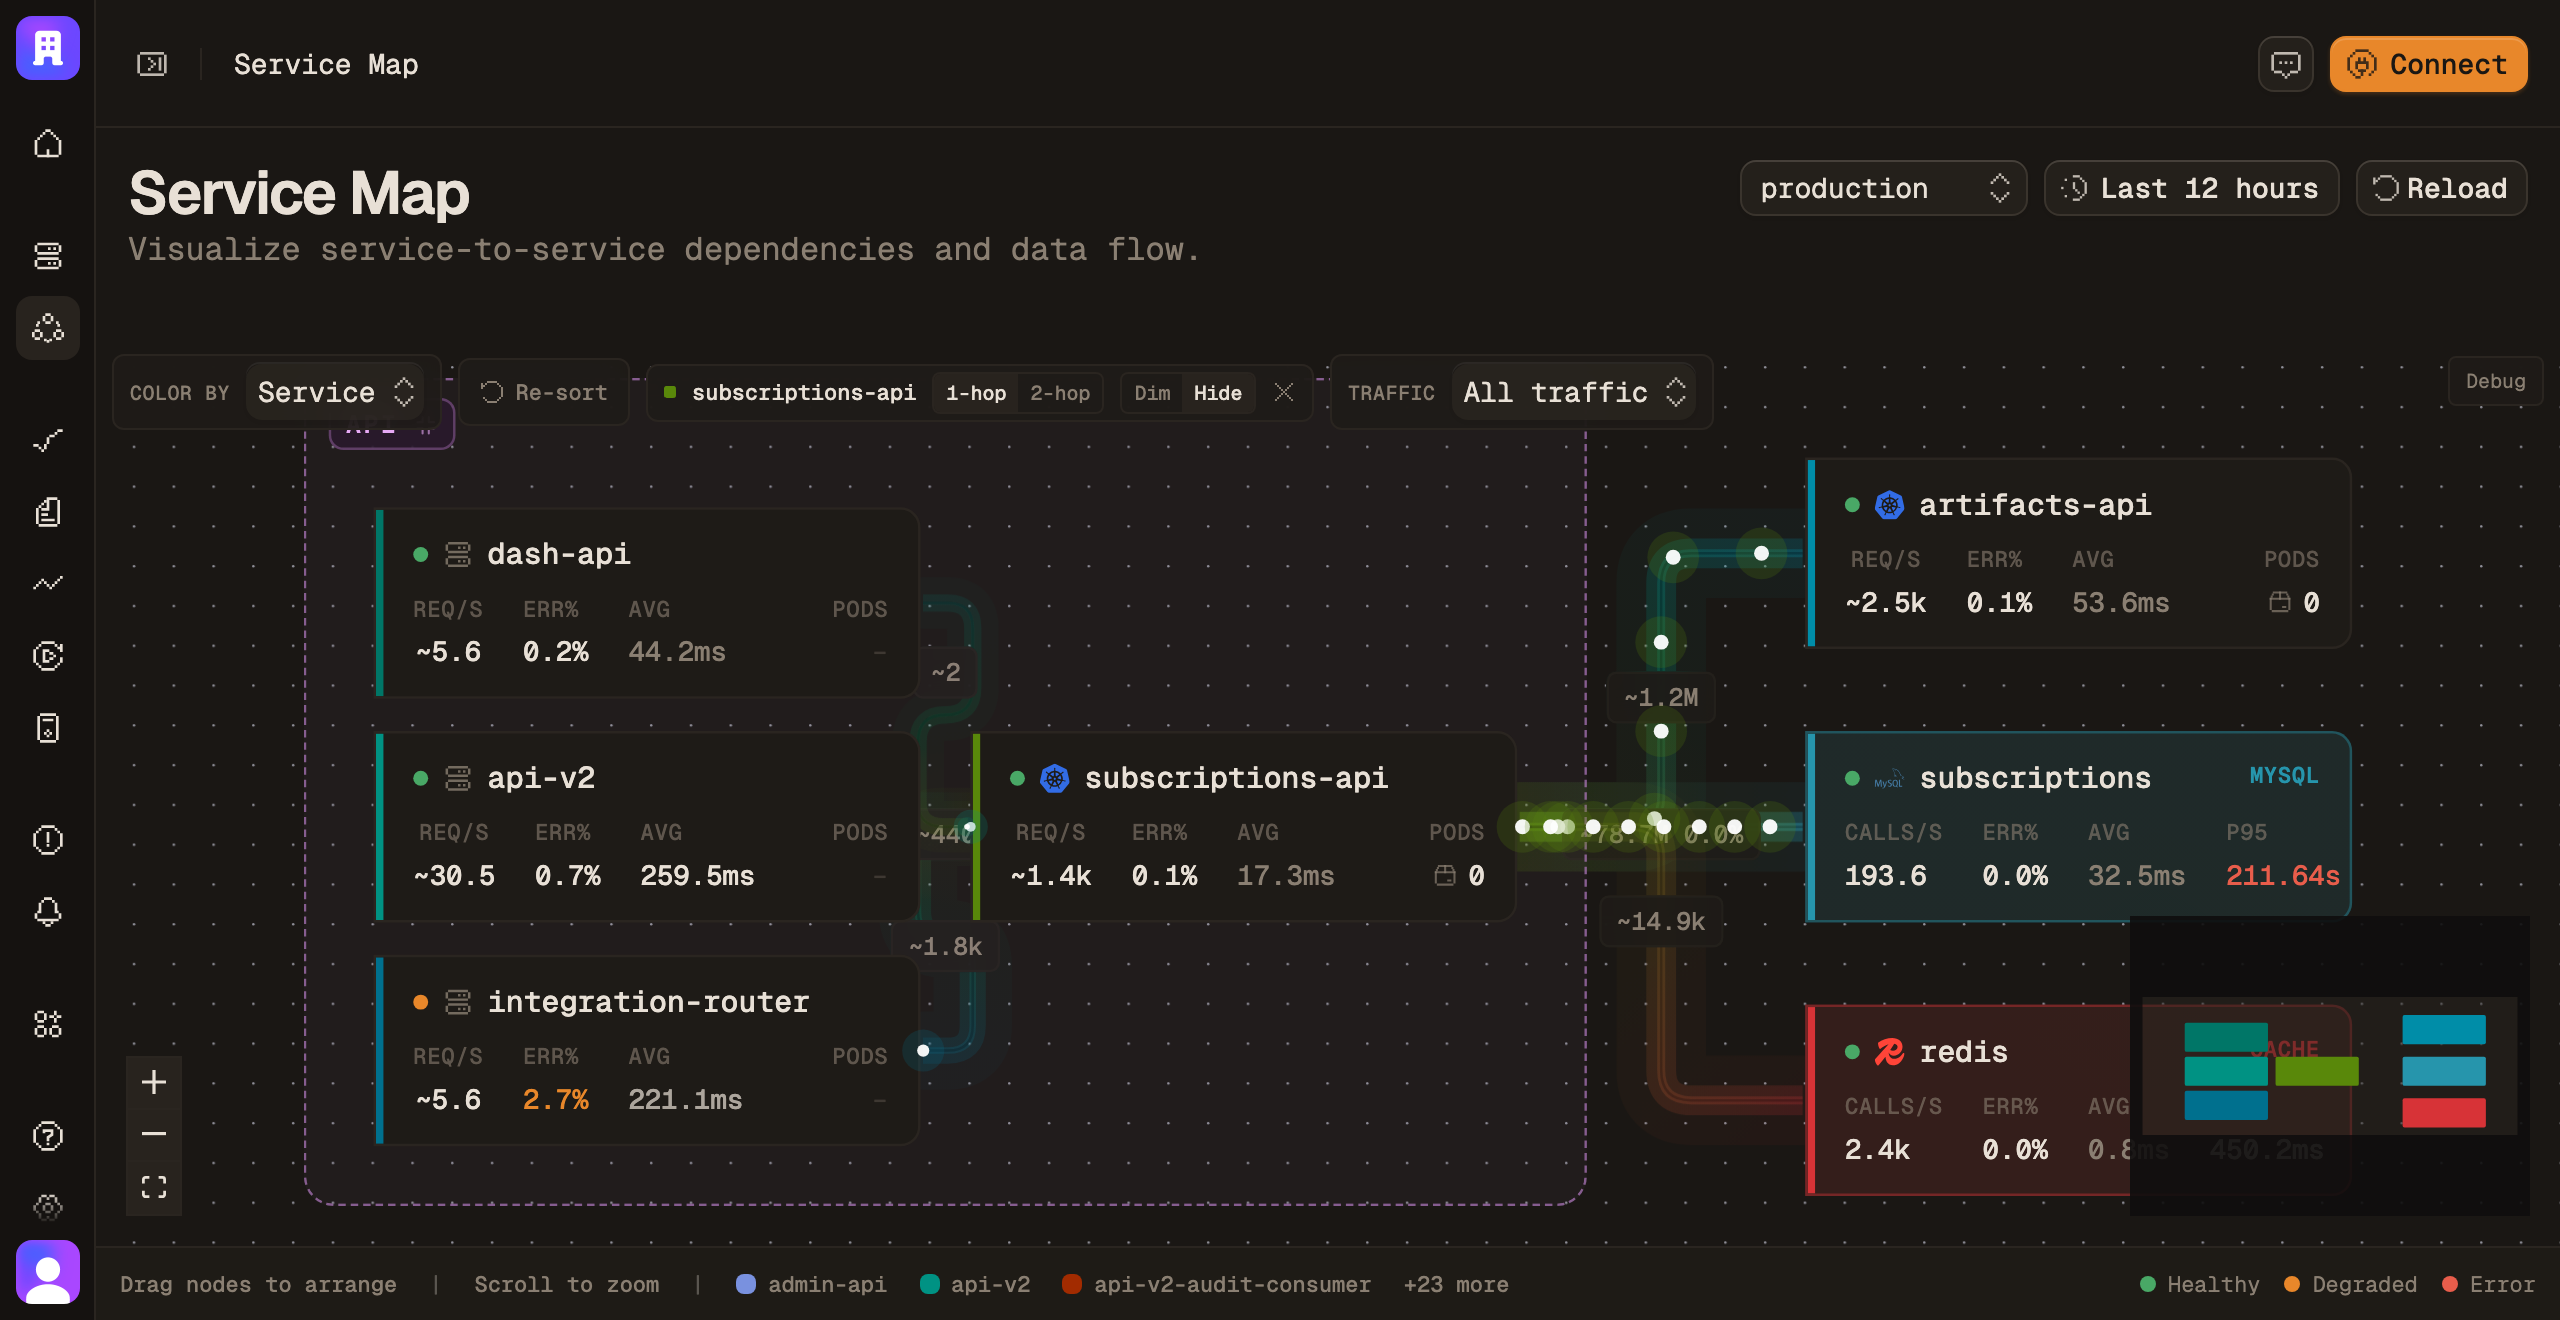
Service map
Live request flow across your services. The cascade you'd otherwise reconstruct from a postmortem, in the foreground.
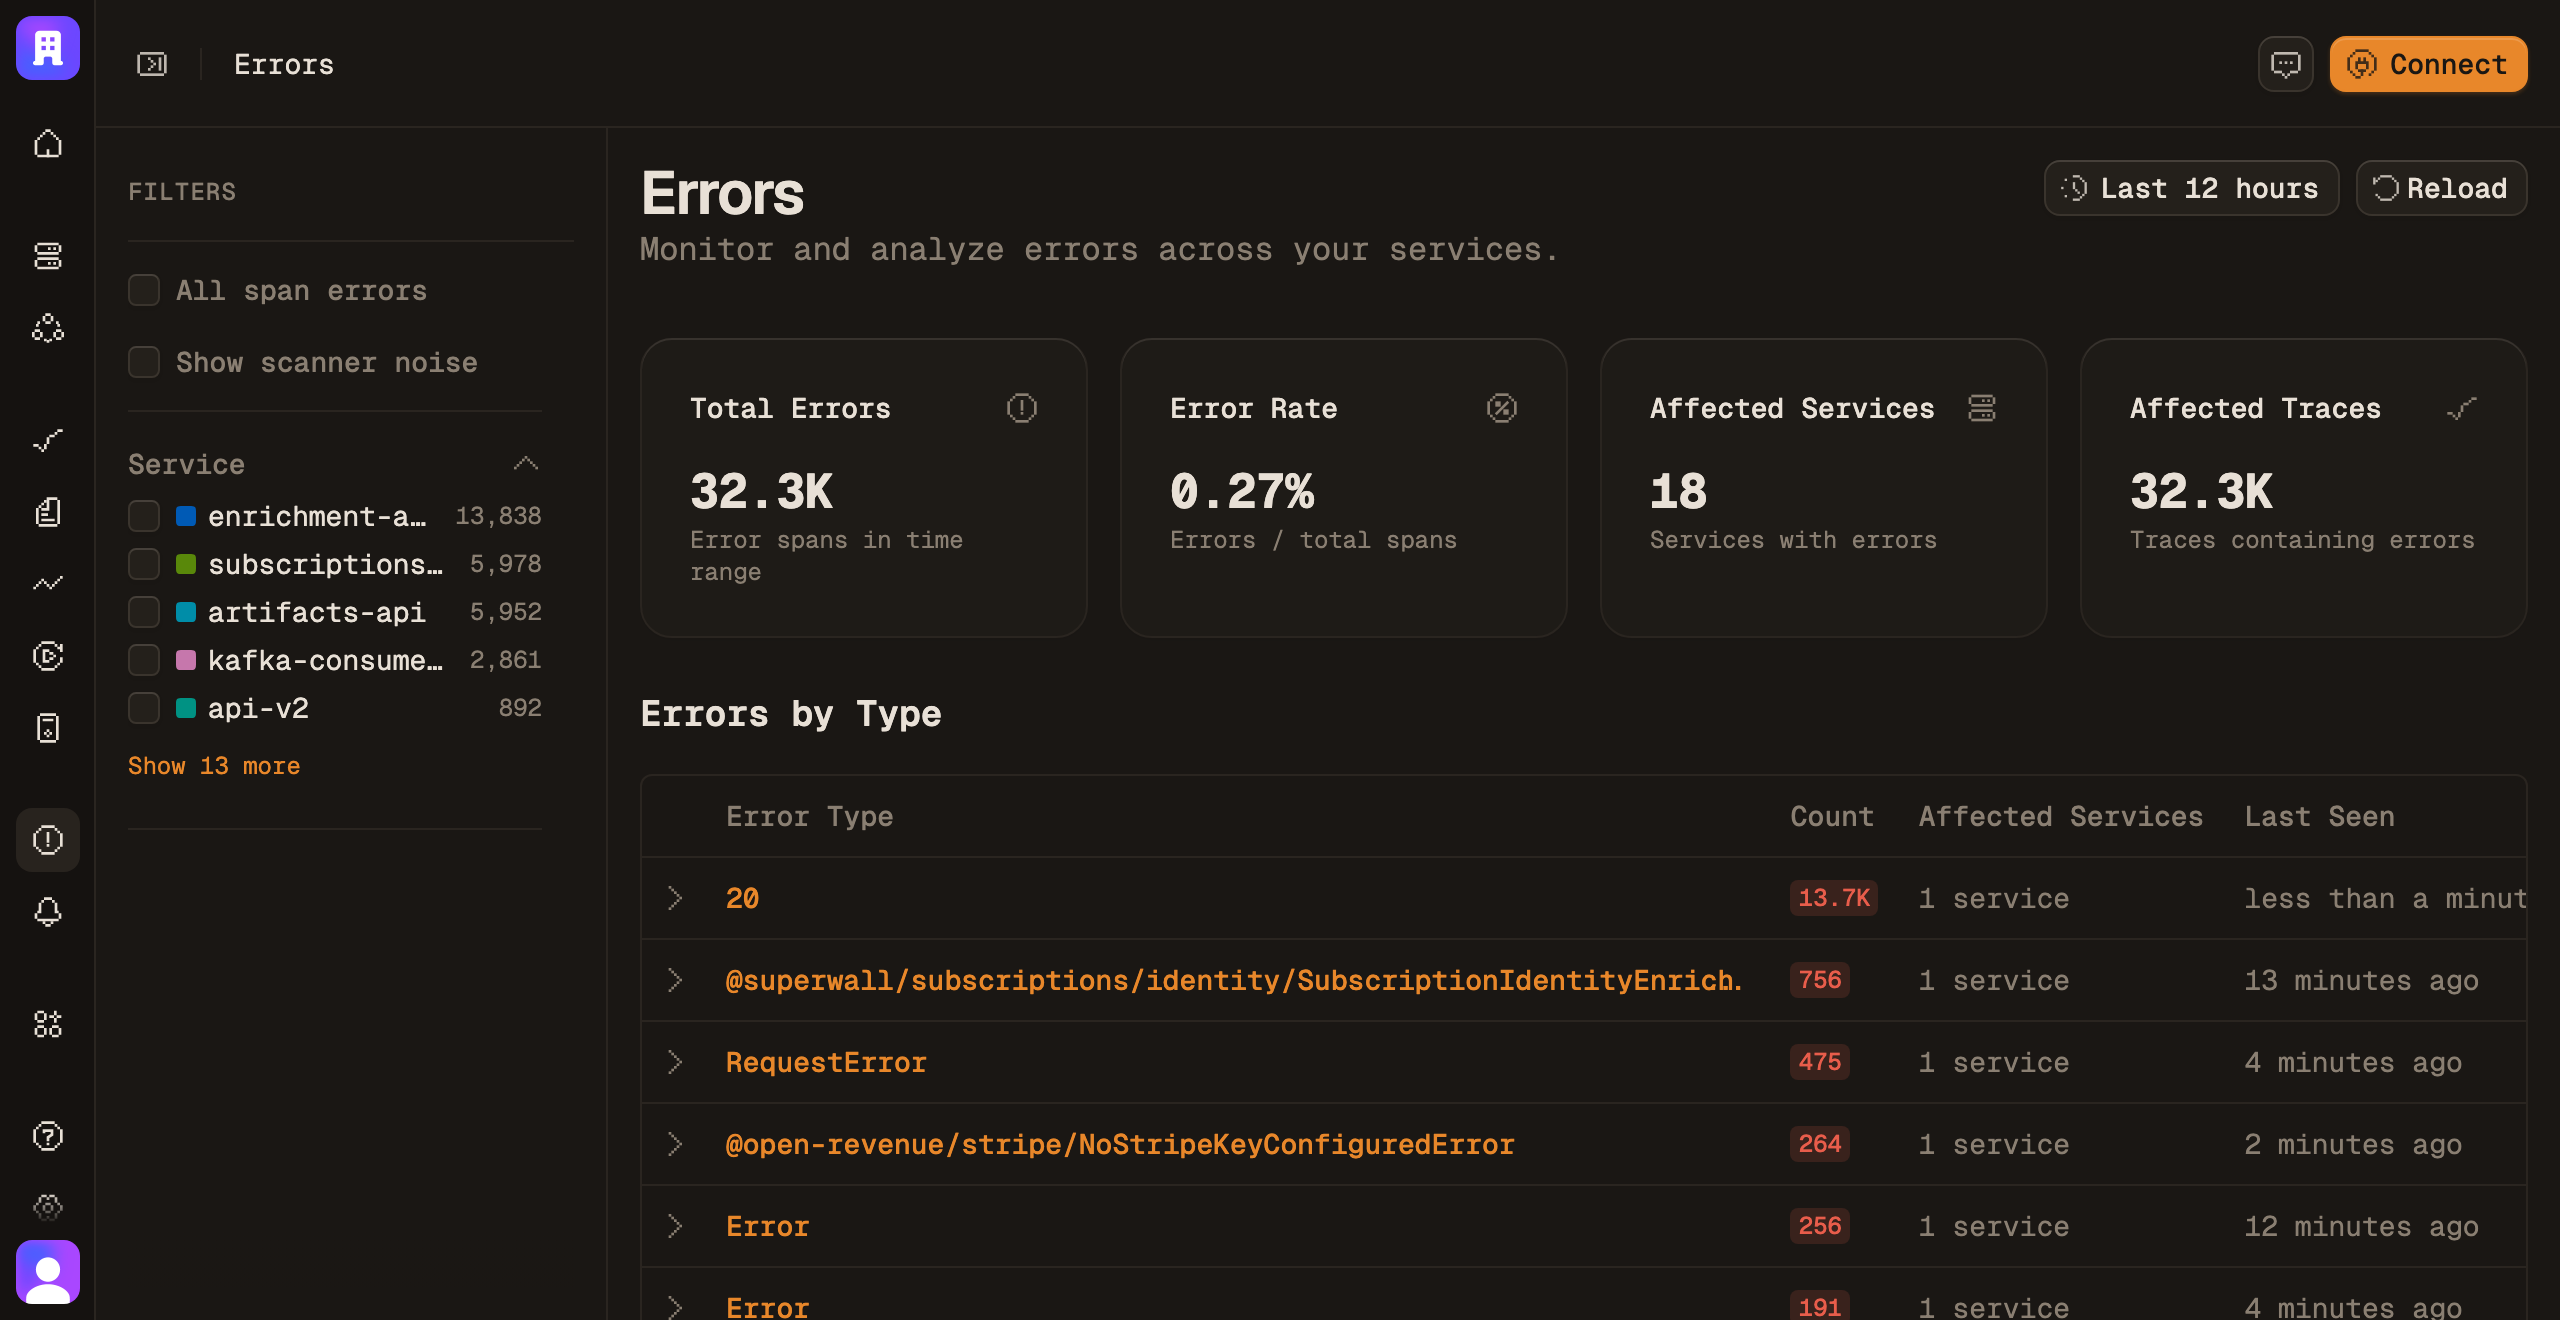
Error tracking
Errors grouped by type across every service, with trends over time, affected services, and sample traces attached.
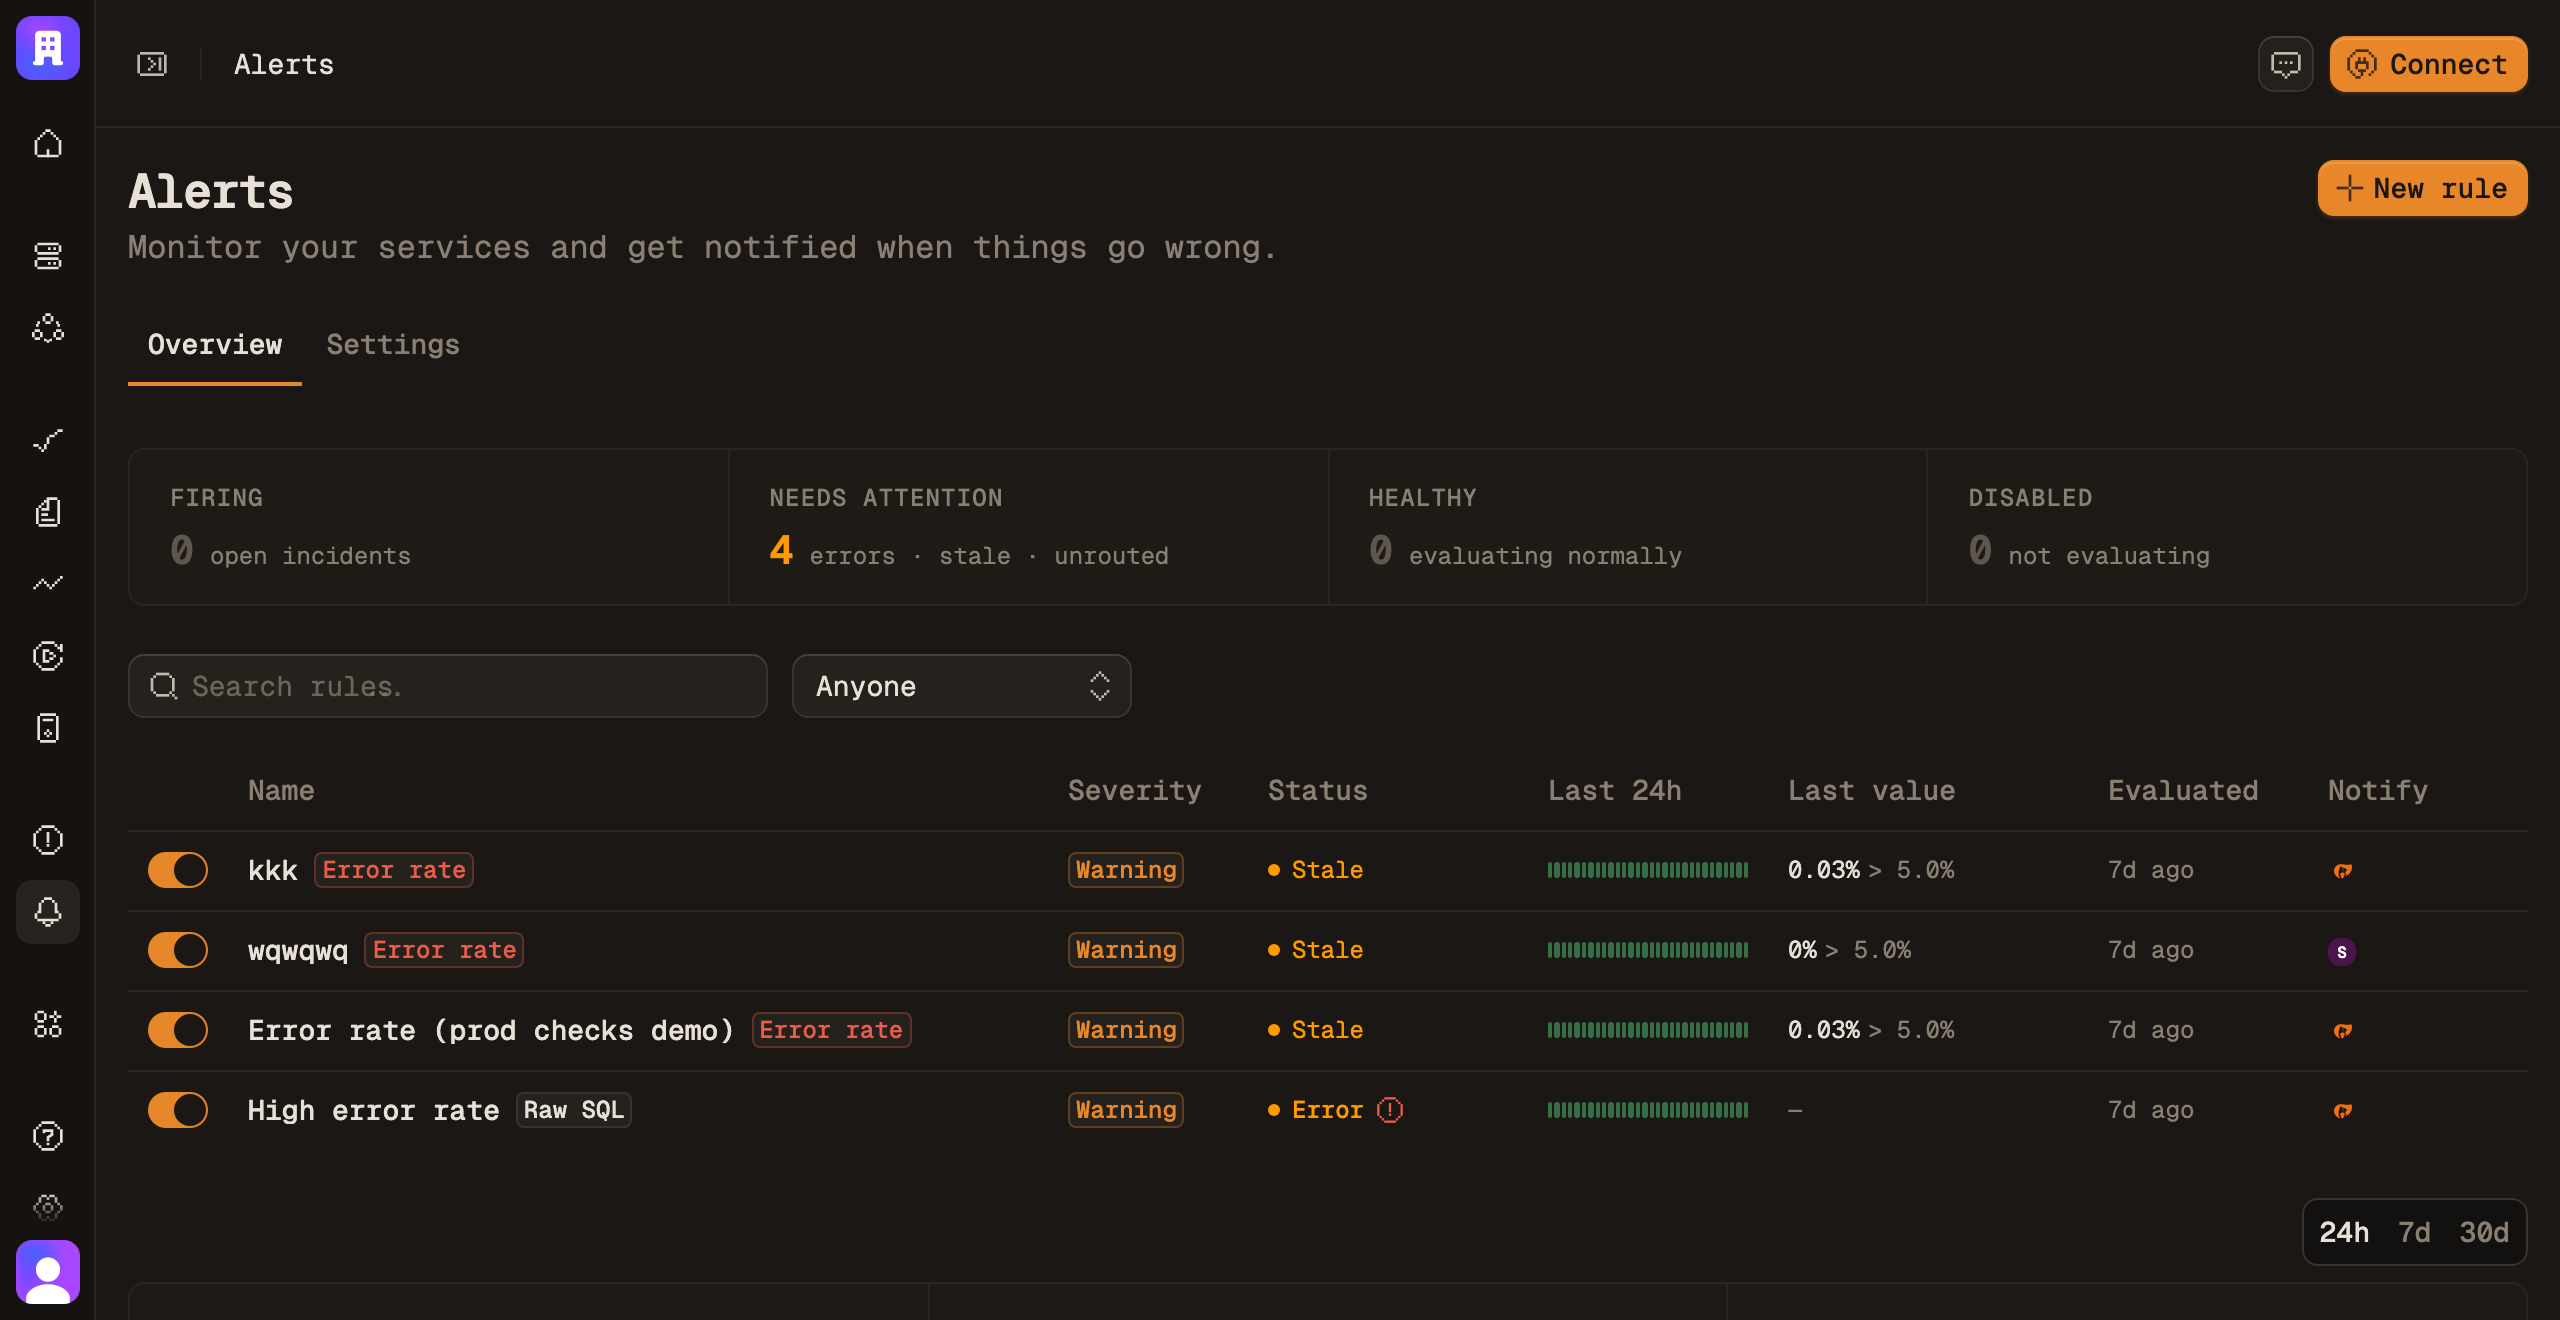
Alerting
Alert on error rate, latency, Apdex, throughput, any query-builder chart or raw SQL. Incidents open and resolve on their own. Routed to Slack, Discord, Telegram, PagerDuty, email, or any webhook.
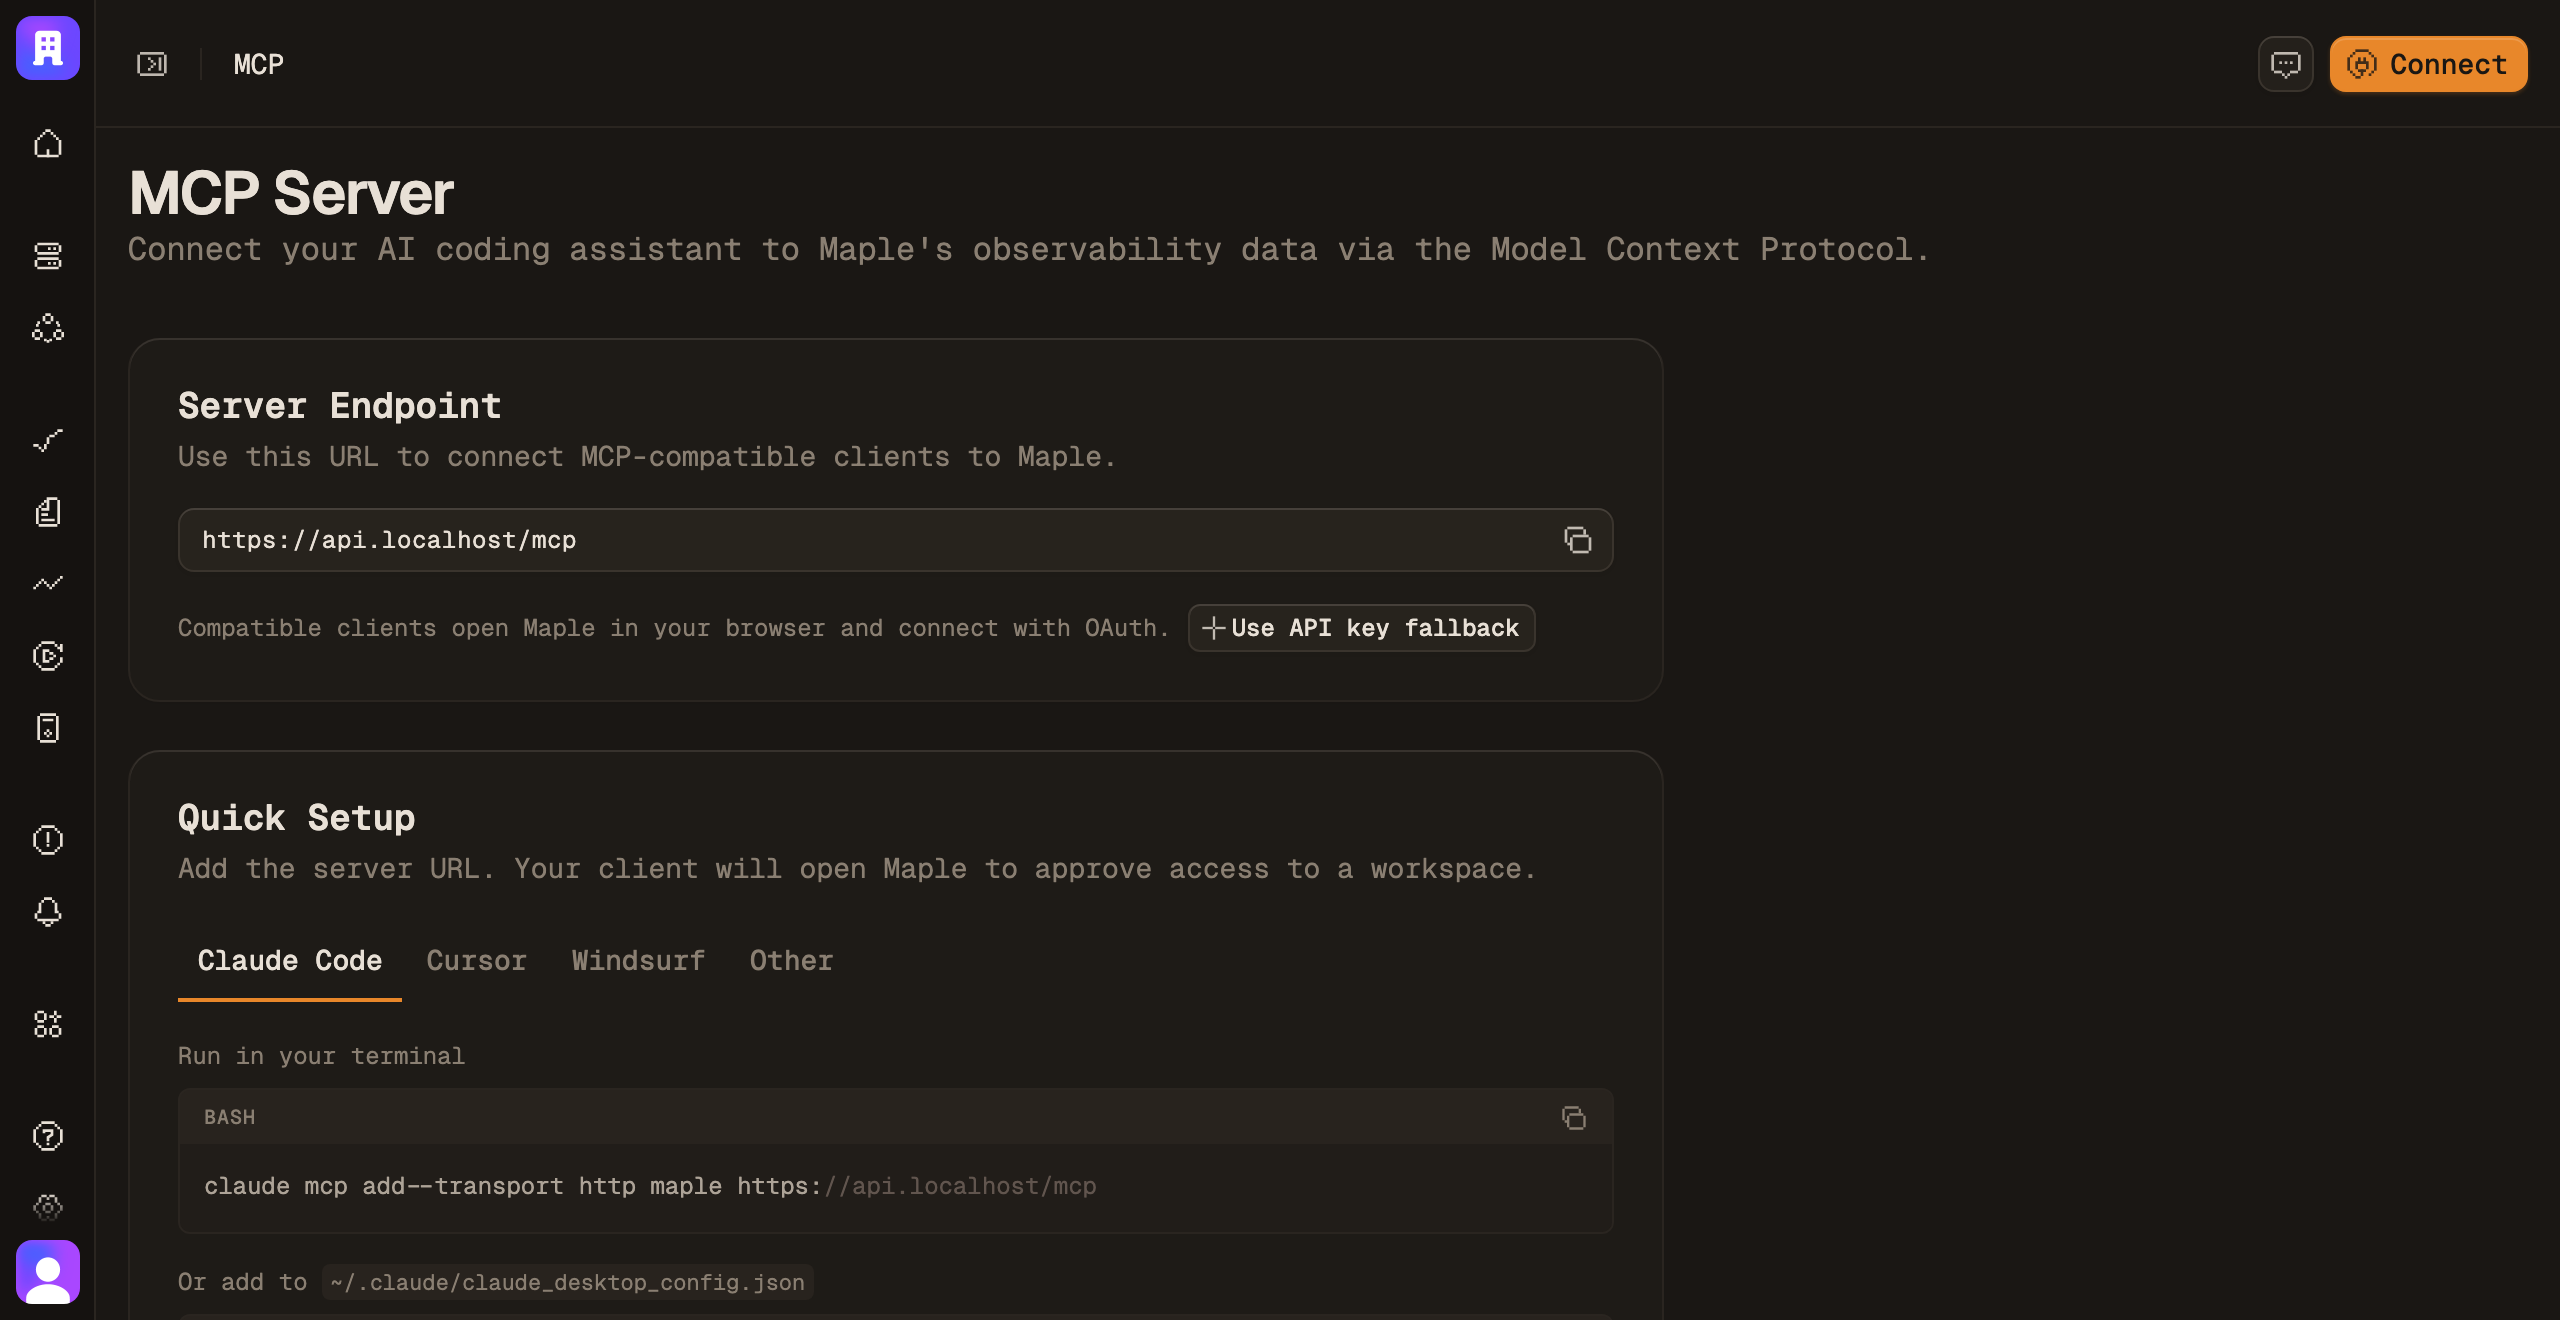
AI & MCP
Any MCP-compatible client can list services, search traces, read the source, and propose a fix. Open protocol, no plugin.
Cloud & Kubernetes
Kubernetes ships as a Helm chart. PlanetScale, Cloudflare, GitHub, and the rest connect with one OAuth grant.
Your data, your instrumentation, your bill.
OpenTelemetry in, no proprietary agent, and the source on GitHub the whole time. You can leave with everything you brought.
- 01 · Open source
- Source on GitHub under FSL-1.1. Each release becomes Apache 2.0 after two years. Read every line, fork it, or self-host on your own boxes if your security review needs that.
- 02 · OpenTelemetry native
- OTLP straight in. No proprietary agent. The instrumentation you write today moves to anywhere OTel-compatible tomorrow.
- 03 · Your perimeter
- Run Maple on your own infrastructure, against a ClickHouse you operate and scale yourself. Your telemetry never has to leave your network, and retention and residency are your call.
- 04 · Honest pricing
- Pay $39/month for 100 GB per signal, then a flat $0.30/GB. No per-host fees. No per-seat fees. The pricing page and your invoice show the same numbers.
06 · Kubernetes
The pod behind the slow span
Install a Helm chart and cluster metrics start flowing. Opt a namespace in, and a slow request takes you straight to the pod that served it.
- A simple Helm chart
- A small chart you can read in full.
- Pods linked to spans
- Go from a slow trace to the pod and node that ran it.
- Cluster-state metrics
- Deployments, replicas and pod status, collected by the chart.
$ helm install maple-k8s-infra maple/k8s-infra07 · Web analytics
Web analytics from the sessions you already record.
Visitors, page views, referrers, countries, devices. No second script, no second vendor.
- One SDK
- MapleBrowser.init records the session. Analytics, replay, and the trace all read from it.
- Bots excluded by default
- Crawlers are filtered out and the excluded count is shown.
- Every row is a filter
- Click a referrer or a country and the page narrows to it. Every session links to its trace.

08 · Agents
The same incident, run by an agent.
Point Claude, Cursor, or any MCP client at Maple's server. The transcript is the exact sequence of tool calls it makes, from a service list to a proposed patch.
- Reads the code behind the trace
- The agent pulls the source file behind a span, so the fix it proposes cites your actual code.
- Writes back
- Claim an issue, set its severity, attach a fix. The agent changes state in Maple as well as reading it.
- OAuth, no plugin
- Point any MCP client at the endpoint and sign in. Open protocol, nothing to install.
The bill, line by line.
Side by side, at list price. The questions your finance team will ask, answered up front.
| Line item | Maple | Datadog | New Relic | Grafana Cloud | Dash0 | SigNoz | Axiom |
|---|---|---|---|---|---|---|---|
| Per-host fee | None | $15+ / host / mo | None | None | None | None | None |
| Per-seat fee | None | None | $10 first, then $99–349 / full-platform user / mo | $8+ / active-user / mo | None | None | None |
| Ingest pricing | $0.30 / GB per signal | $0.10 / GB + $1.70 / M indexed | $0.40 / GB | $0.55 / GB | $0.60 / M spans or logs · $0.20 / M metric points | $0.30 / GB · $0.10 / M samples | $0.12 / GB + $0.20 / GB-hr |
| Default retention | 30d default · custom | 15d indexed logs (option shown) | 30d logs · 8d traces | 30d logs/traces · 13mo metrics | 30d spans/logs · 13mo metrics | 15d logs/traces · 1mo metrics | Configurable · from $0.03 / GB stored |
| OpenTelemetry support | Native | Yes | Yes | Yes | Native | Native | Native |
| License | FSL-1.1 → Apache 2.0 | Proprietary | Proprietary | AGPL components | Proprietary | MIT + commercial ee/ | Proprietary |
| Self-host option | Supported | No | No | OSS components | No | Supported | No |
| MCP / agent surface | Hosted server | Yes | Yes | Yes | Yes | Yes | Yes |
Competitor cells summarize public list prices, checked September 2026. Check each vendor's pricing page for current numbers. Maple's rate is the published per-GB rate, billed per signal. Use the calculator to project your monthly cost.
10 · Pricing
One plan, billed by the gigabyte.
One plan. 100 GB per signal included, then a flat rate. Nothing metered by host, seat, or query.
Everything is included.
Free for 14 days · Cancel anytime · Card required to start
Hosted in the US or the EU (Frankfurt) at the same price. EU hosting
30-day retention · Private support channel · Unlimited dashboards · Advanced alerting · MCP server · AI chat · AI error triaging · Full API access
Estimate your bill →Higher volume, custom retention, priority support.
Works with every language OpenTelemetry supports
Common questions
What is Maple?
Is Maple open source?
Is Maple OpenTelemetry-native?
How is Maple priced?
Does Maple work with AI agents?
Can I self-host Maple?
Where is my data stored?

Try it on your own traces.
14-day free trial, card required, no charge until it ends. Or self-host, or run maple start locally with no account at all.