Use Cases

Checkout is failing. Which orders, and why.

During a sale, an error rate is not the question — the question is which customers lost their basket and what stopped them. One order id carries the answer across all three surfaces.

signal POST /checkout error rate 8.4% · threshold 1%

The path

One order, from the alert to the timeout

order_8421 is a real order that failed. Every surface below is filtered to it, so nothing has to be matched up by timestamp between two tools.

  1. alert T+0:00 · orderorder_8421

    The alert fires on the checkout route only

    Error rate on POST /checkout crosses its threshold while the rest of the site holds. That scoping is the first fact: this is not the sale traffic, it is the payment path.
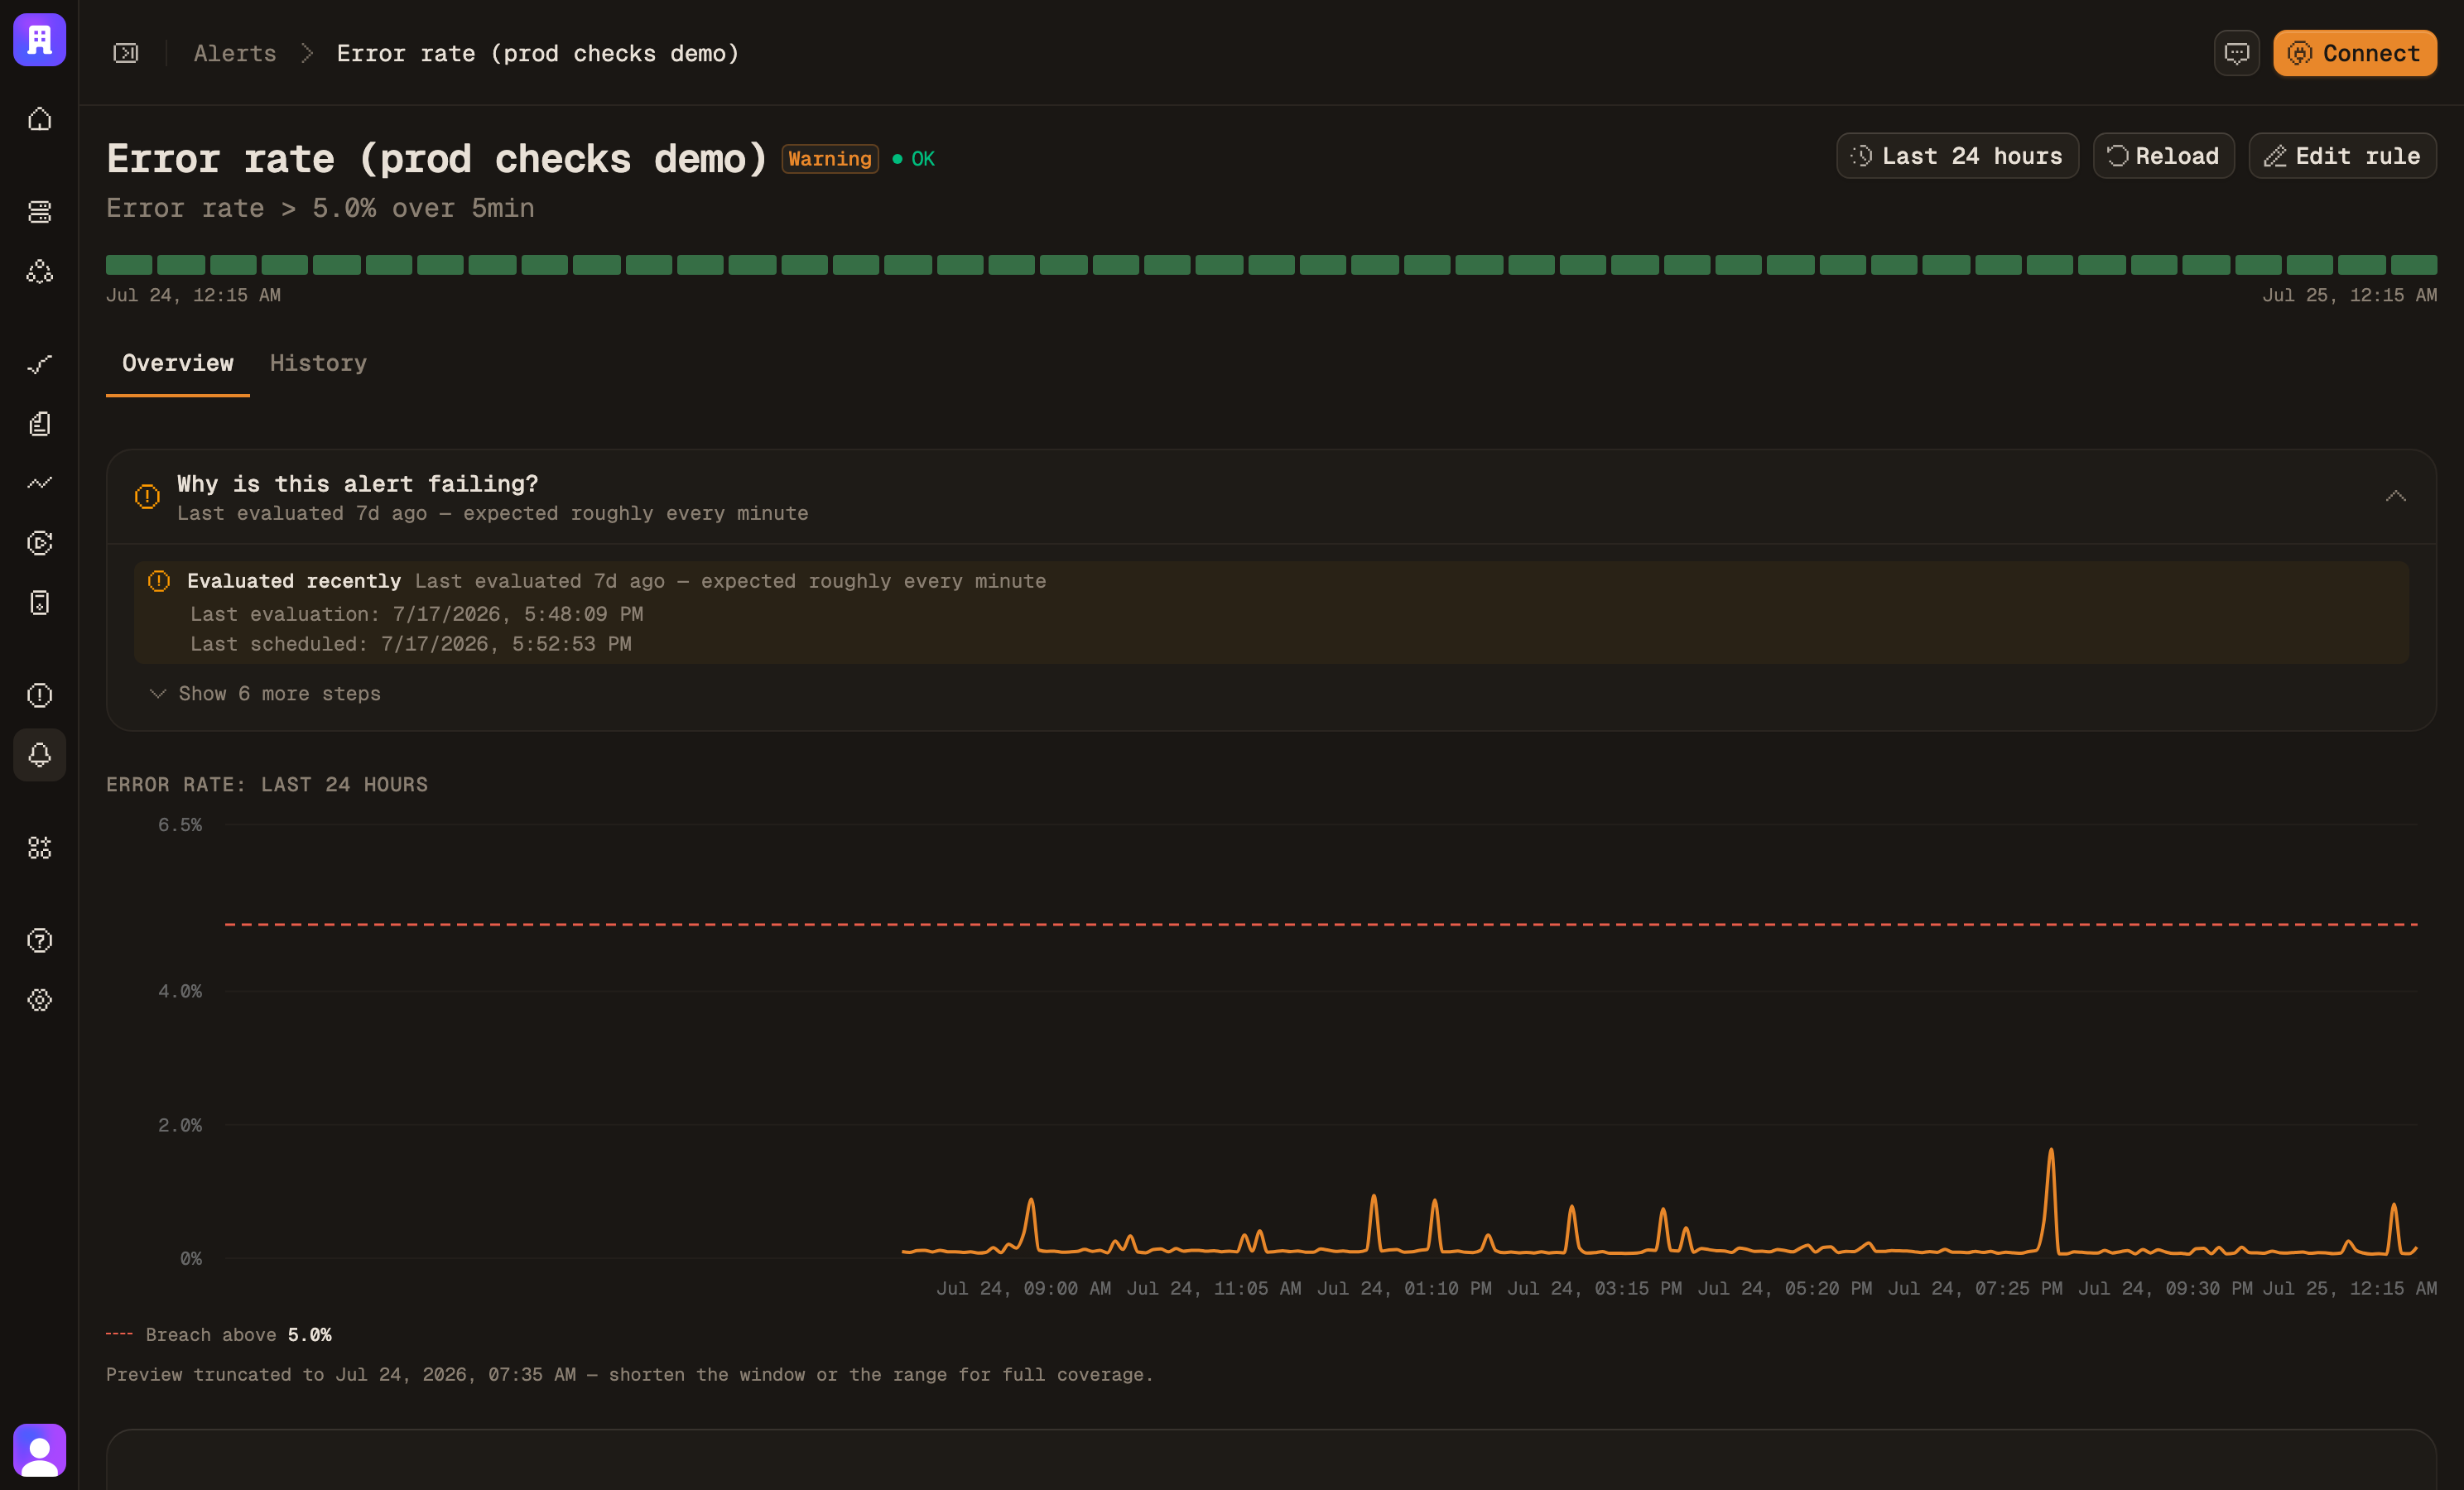
    An alert rule with its threshold, evaluation window and firing history
  2. trace T+0:25 · orderorder_8421

    The trace ends at Stripe

    Open one failed order and the waterfall is unambiguous. Three retries sit at the bottom, red, each timing out at exactly 1.75 s — the client's own deadline, not the provider's.
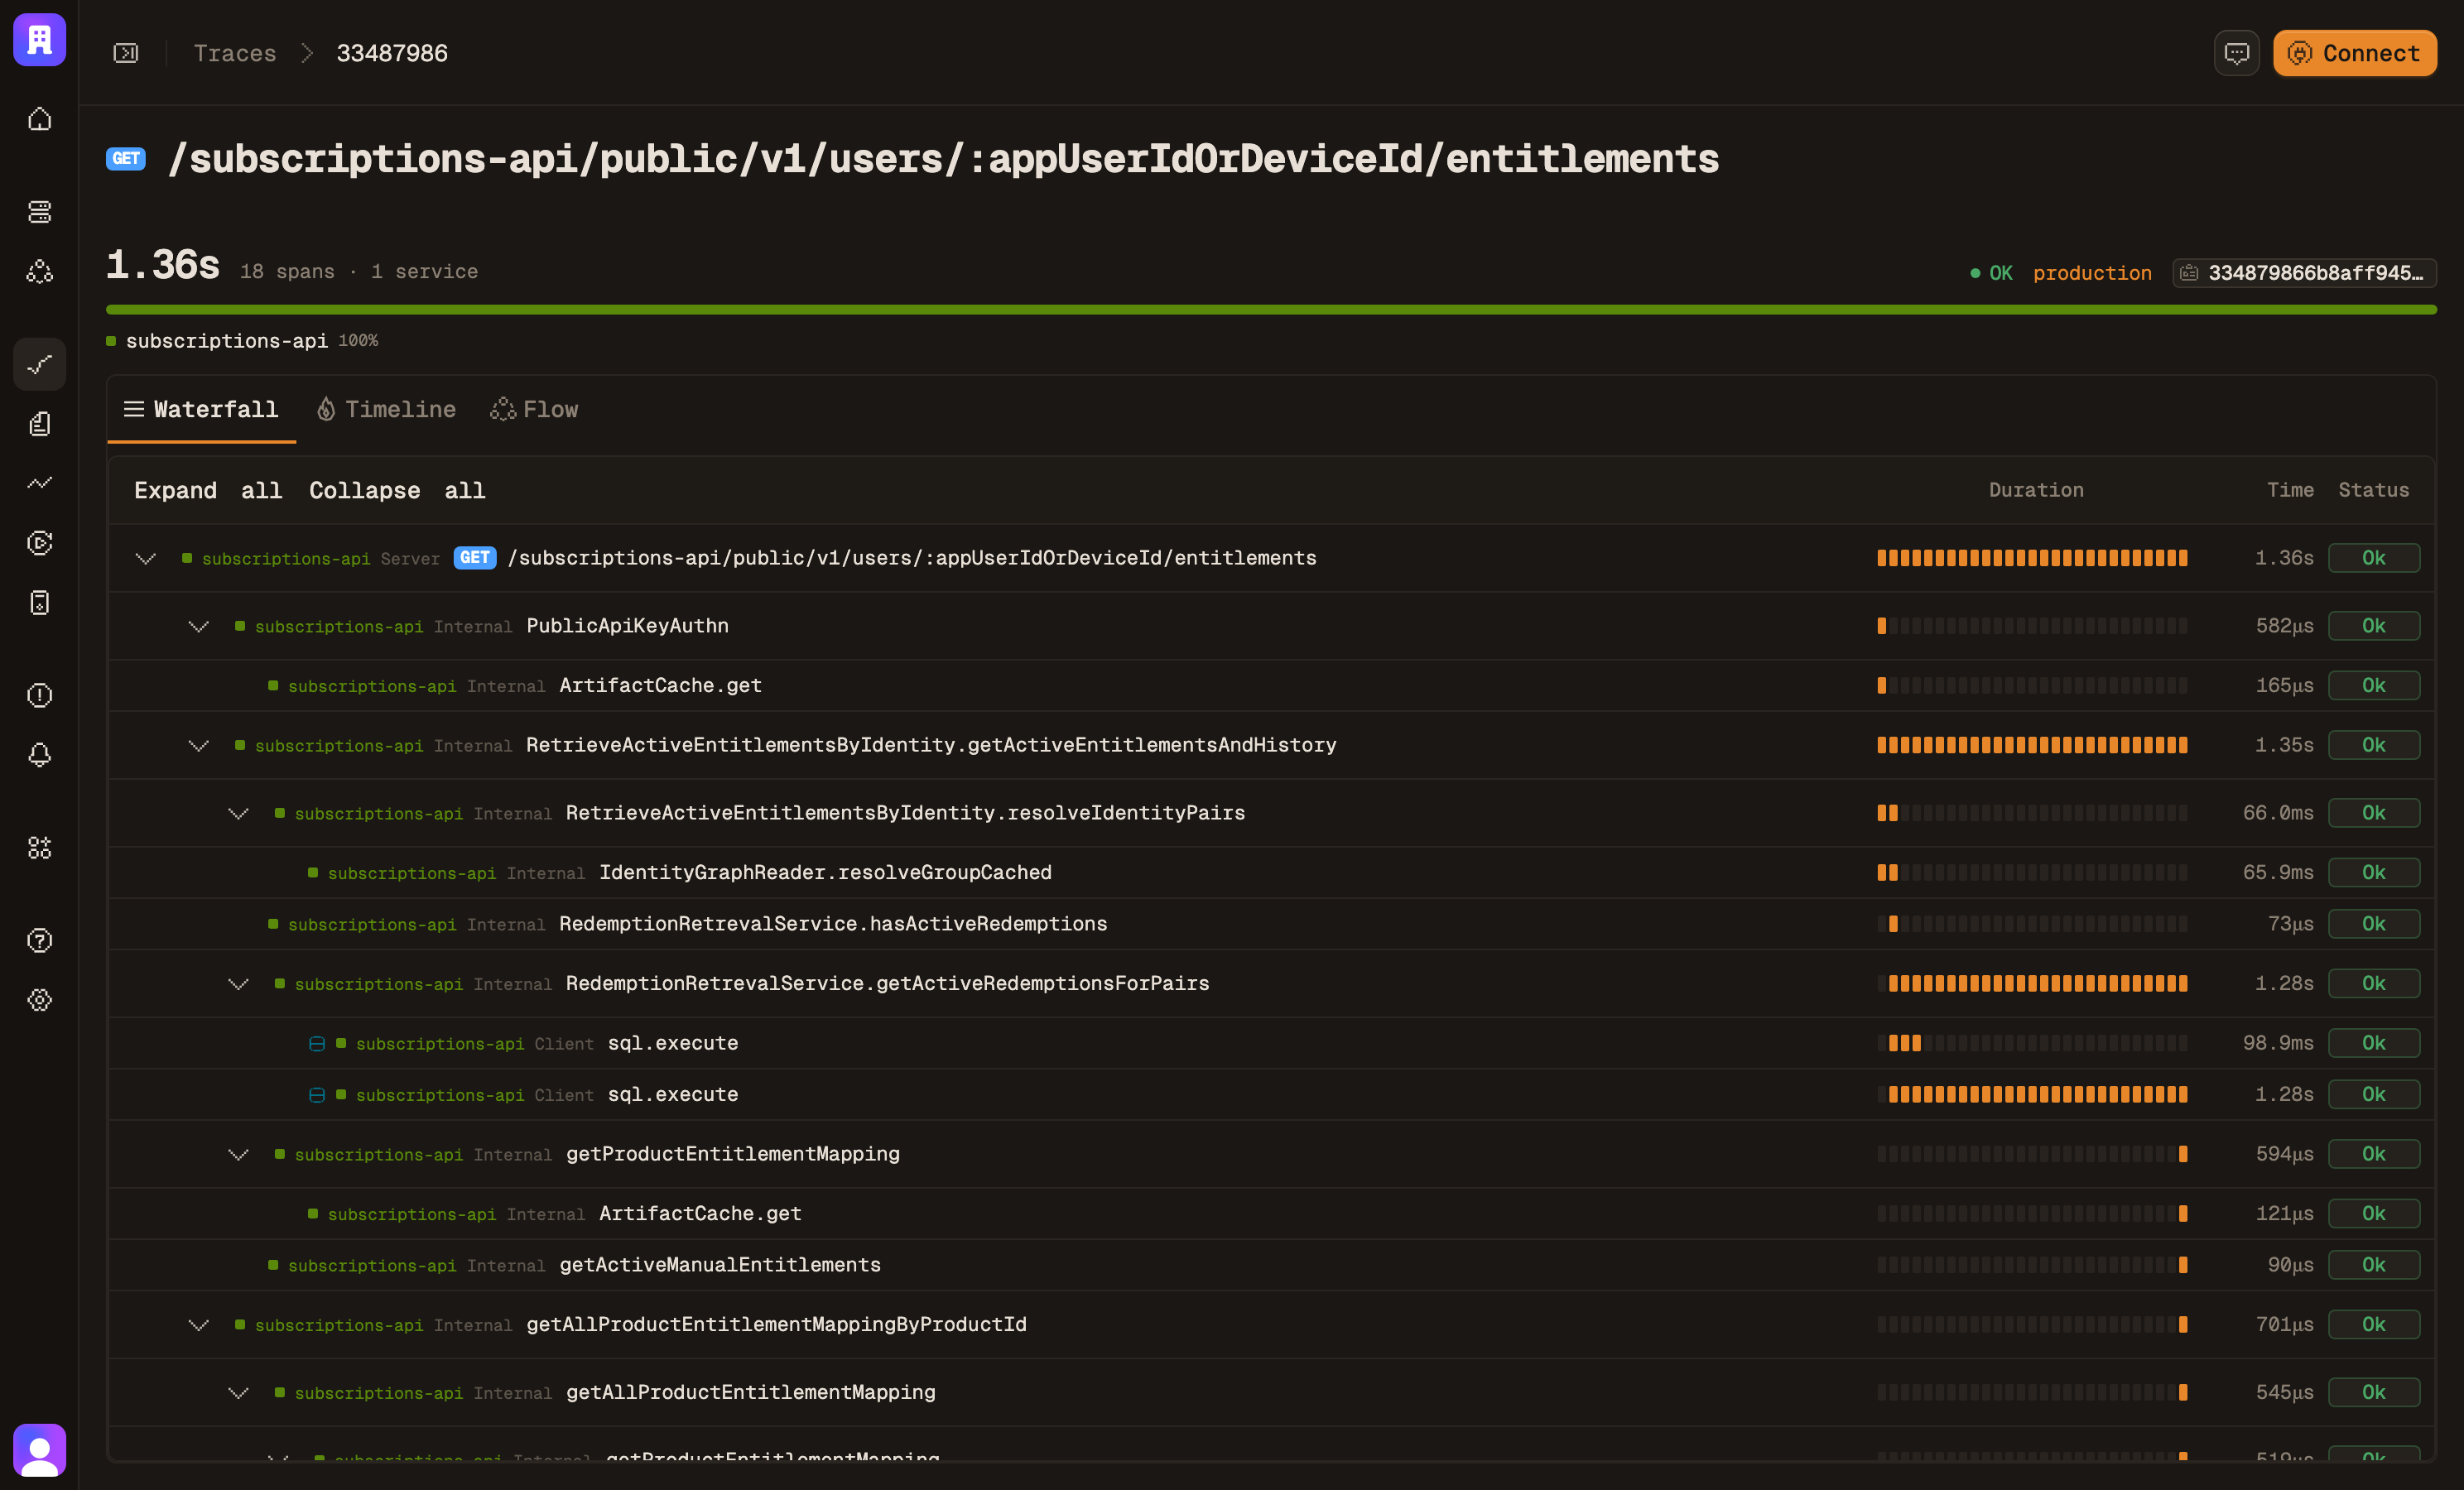
    An 18-span API trace waterfall with nested application and SQL operations
  3. logs T+2:10 · orderorder_8421

    The logs say the pool was empty

    The lines written during those spans carry the same trace id. Retry budget exhausted, then connection pool at capacity — the timeout was a symptom of waiting for a connection, not of Stripe being slow.
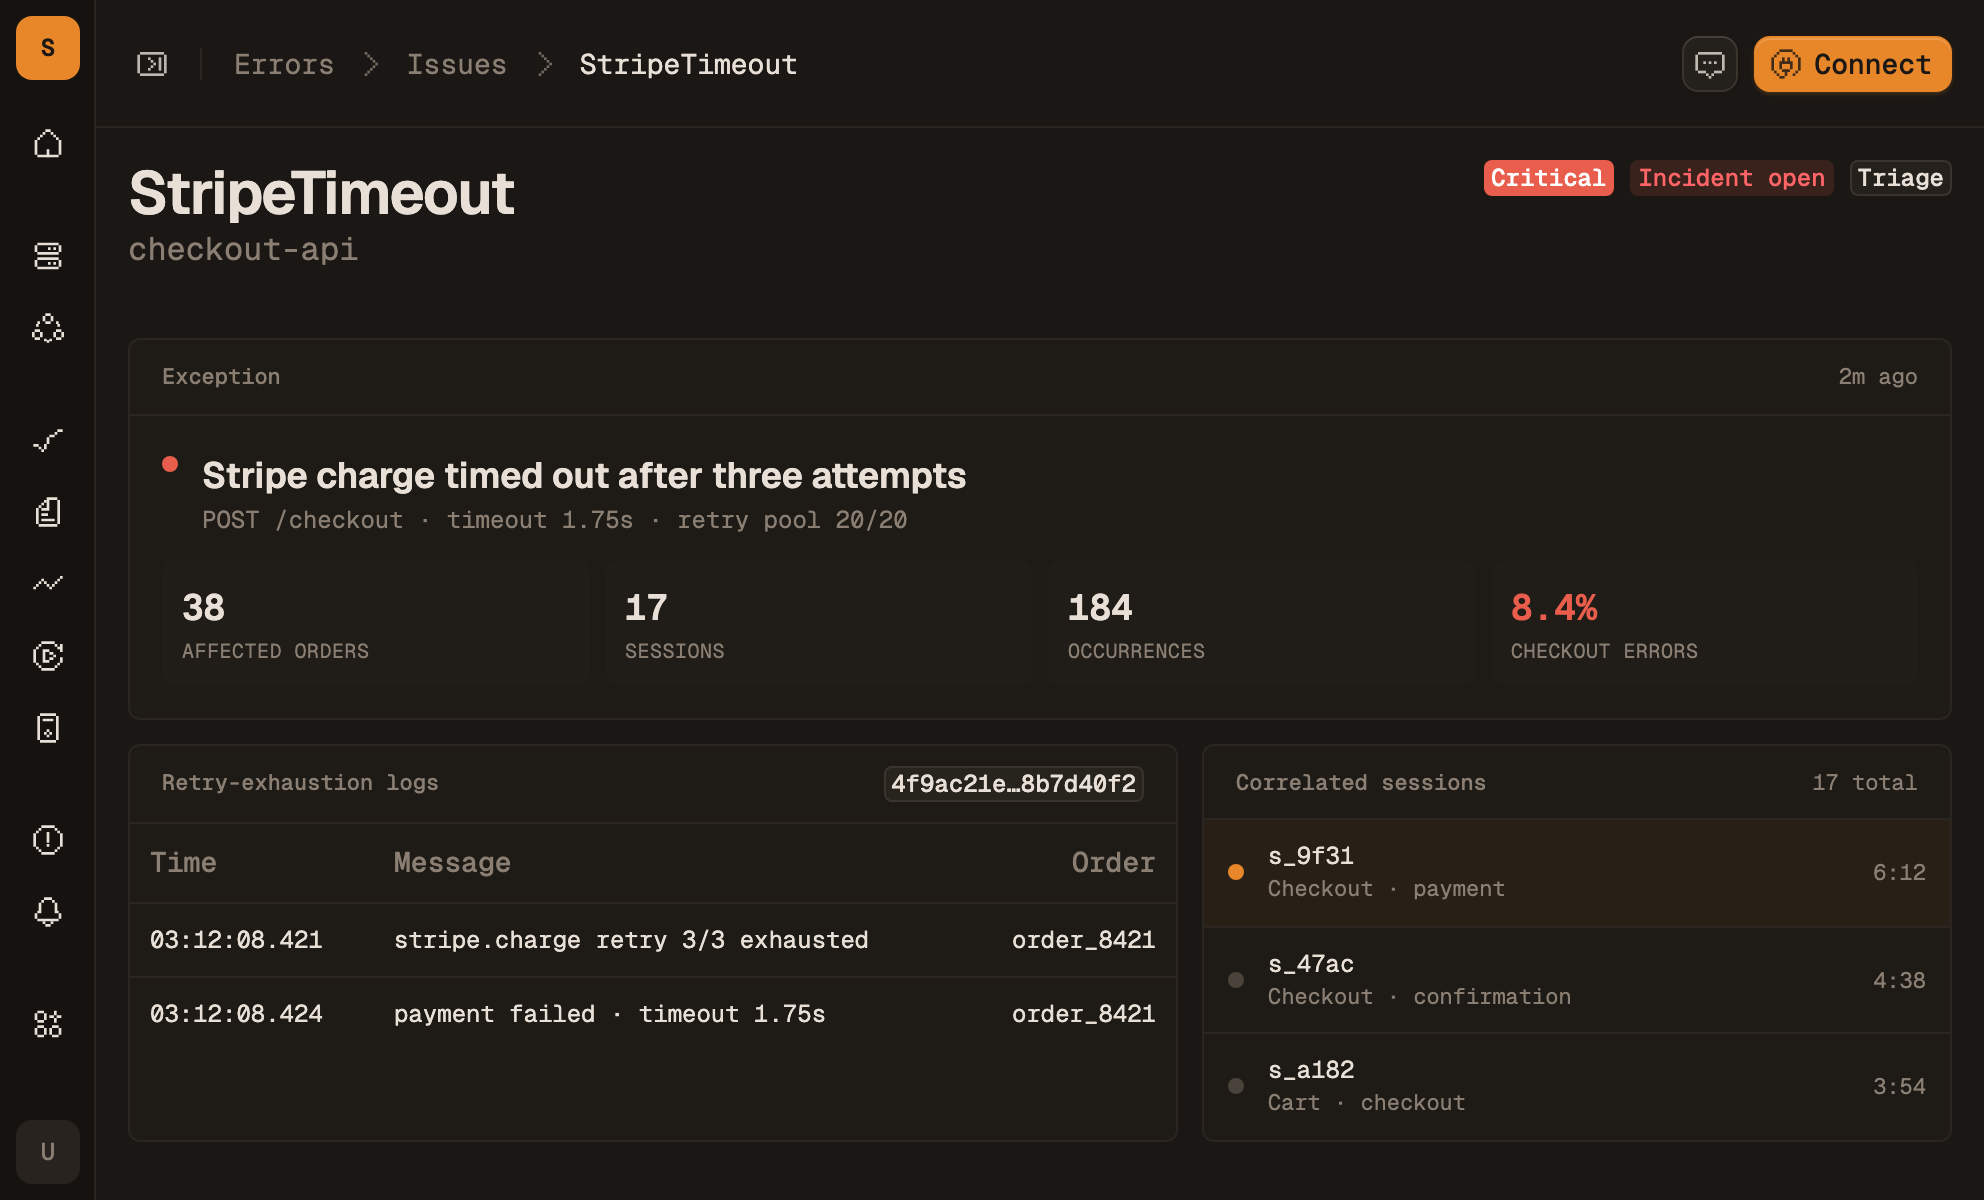
    The StripeTimeout issue with its affected-order count and the sessions that produced them

outcome

Pool raised and the retry budget cut to two. Checkout error rate back to baseline within one evaluation window.

2 min
alert to root cause
3
retries per failed order
1.75 s
timeout, every time

What it does

Why the order id held

order.id
Business ids are just attributes
Set order.id on the span once and it is filterable everywhere spans are — the trace list, the error issue, the log search. No separate index to maintain.
SpanKind.CLIENT
Outbound calls are spans too
The Stripe call is a client span with its own duration and status, so a third-party timeout is measured rather than inferred from your own error rate.
trace_id
Logs are joined, not searched twice
The lines behind a span are reached from the span, not from a text query narrowed by hand to the same minute. That is the step that usually costs the most time.

Keep going

The same data, other jobs

Point OTLP at Maple.

One endpoint, one key. Traces, logs, metrics and sessions land on the same trace id from the first request.