The path
Two hops from the symptom to the cause
payment-svc@1.4.2 is the release that shipped four hours before the symptom. It holds the path together — the map, the trace and the logs are all filtered to it.
- map T+0:00 · deploypayment-svc@1.4.2
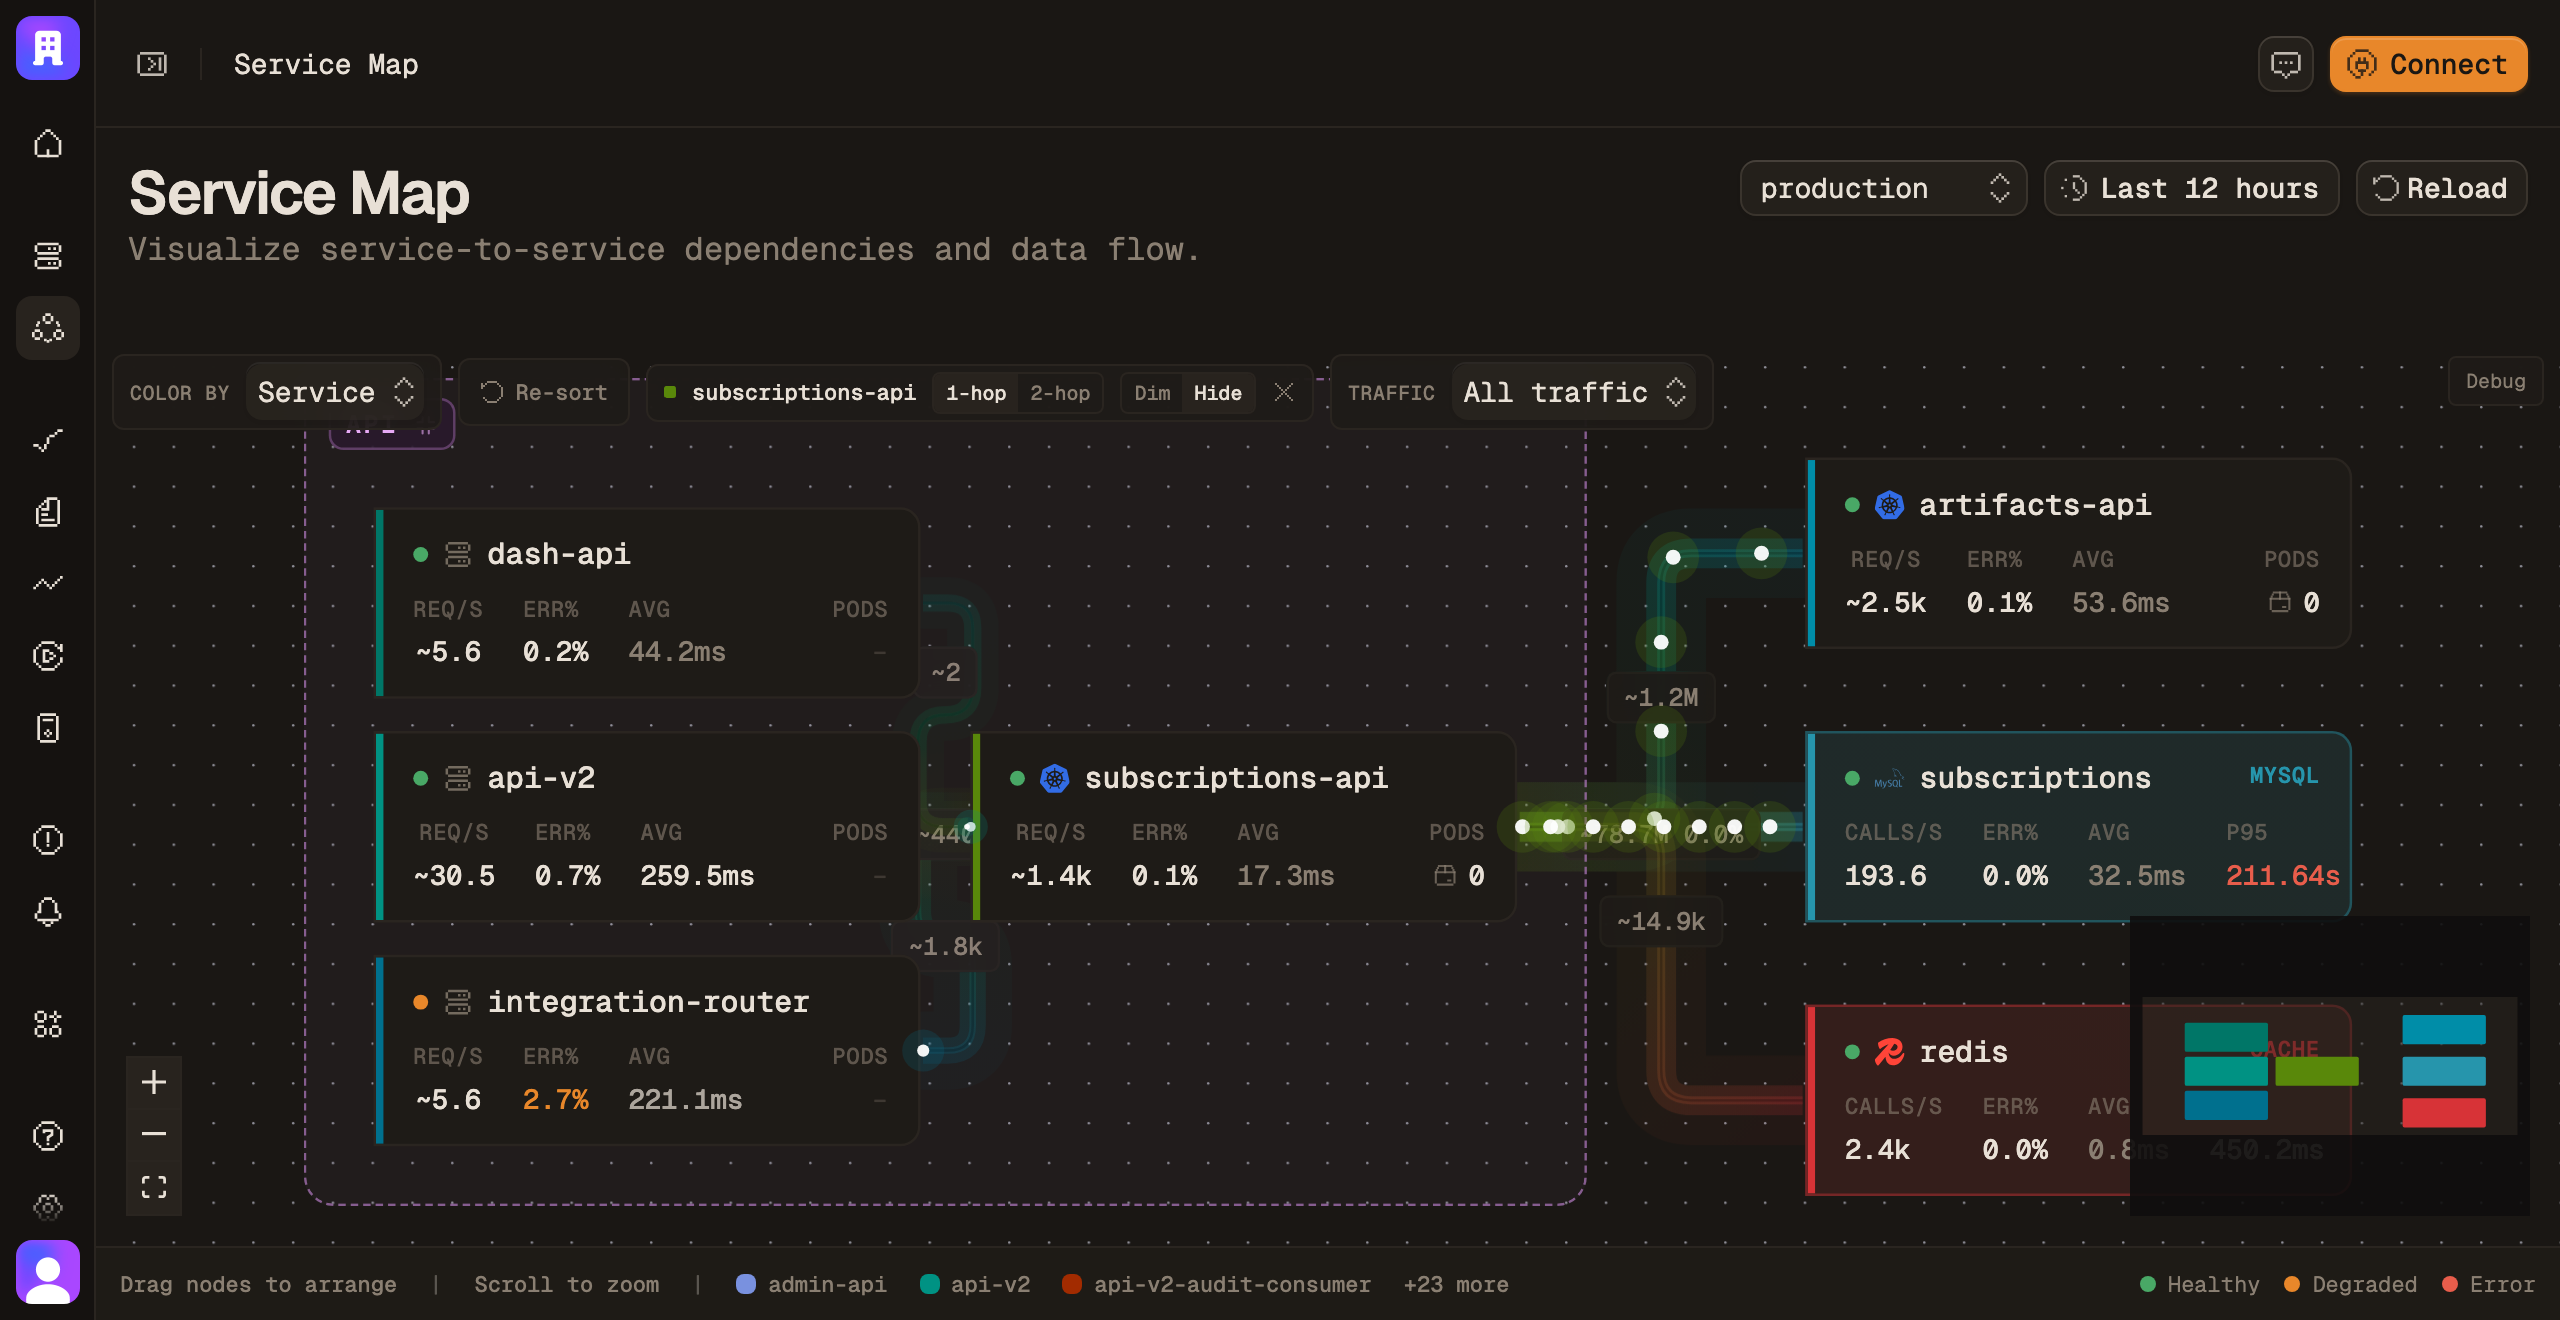
The map shows a slow edge, not a slow service
api-gateway is the service being paged about, but its own spans are fine. The degraded edge is two hops in: payment-svc to user-db, average up from 12 ms to 210 ms.
- trace T+1:10 · deploypayment-svc@1.4.2
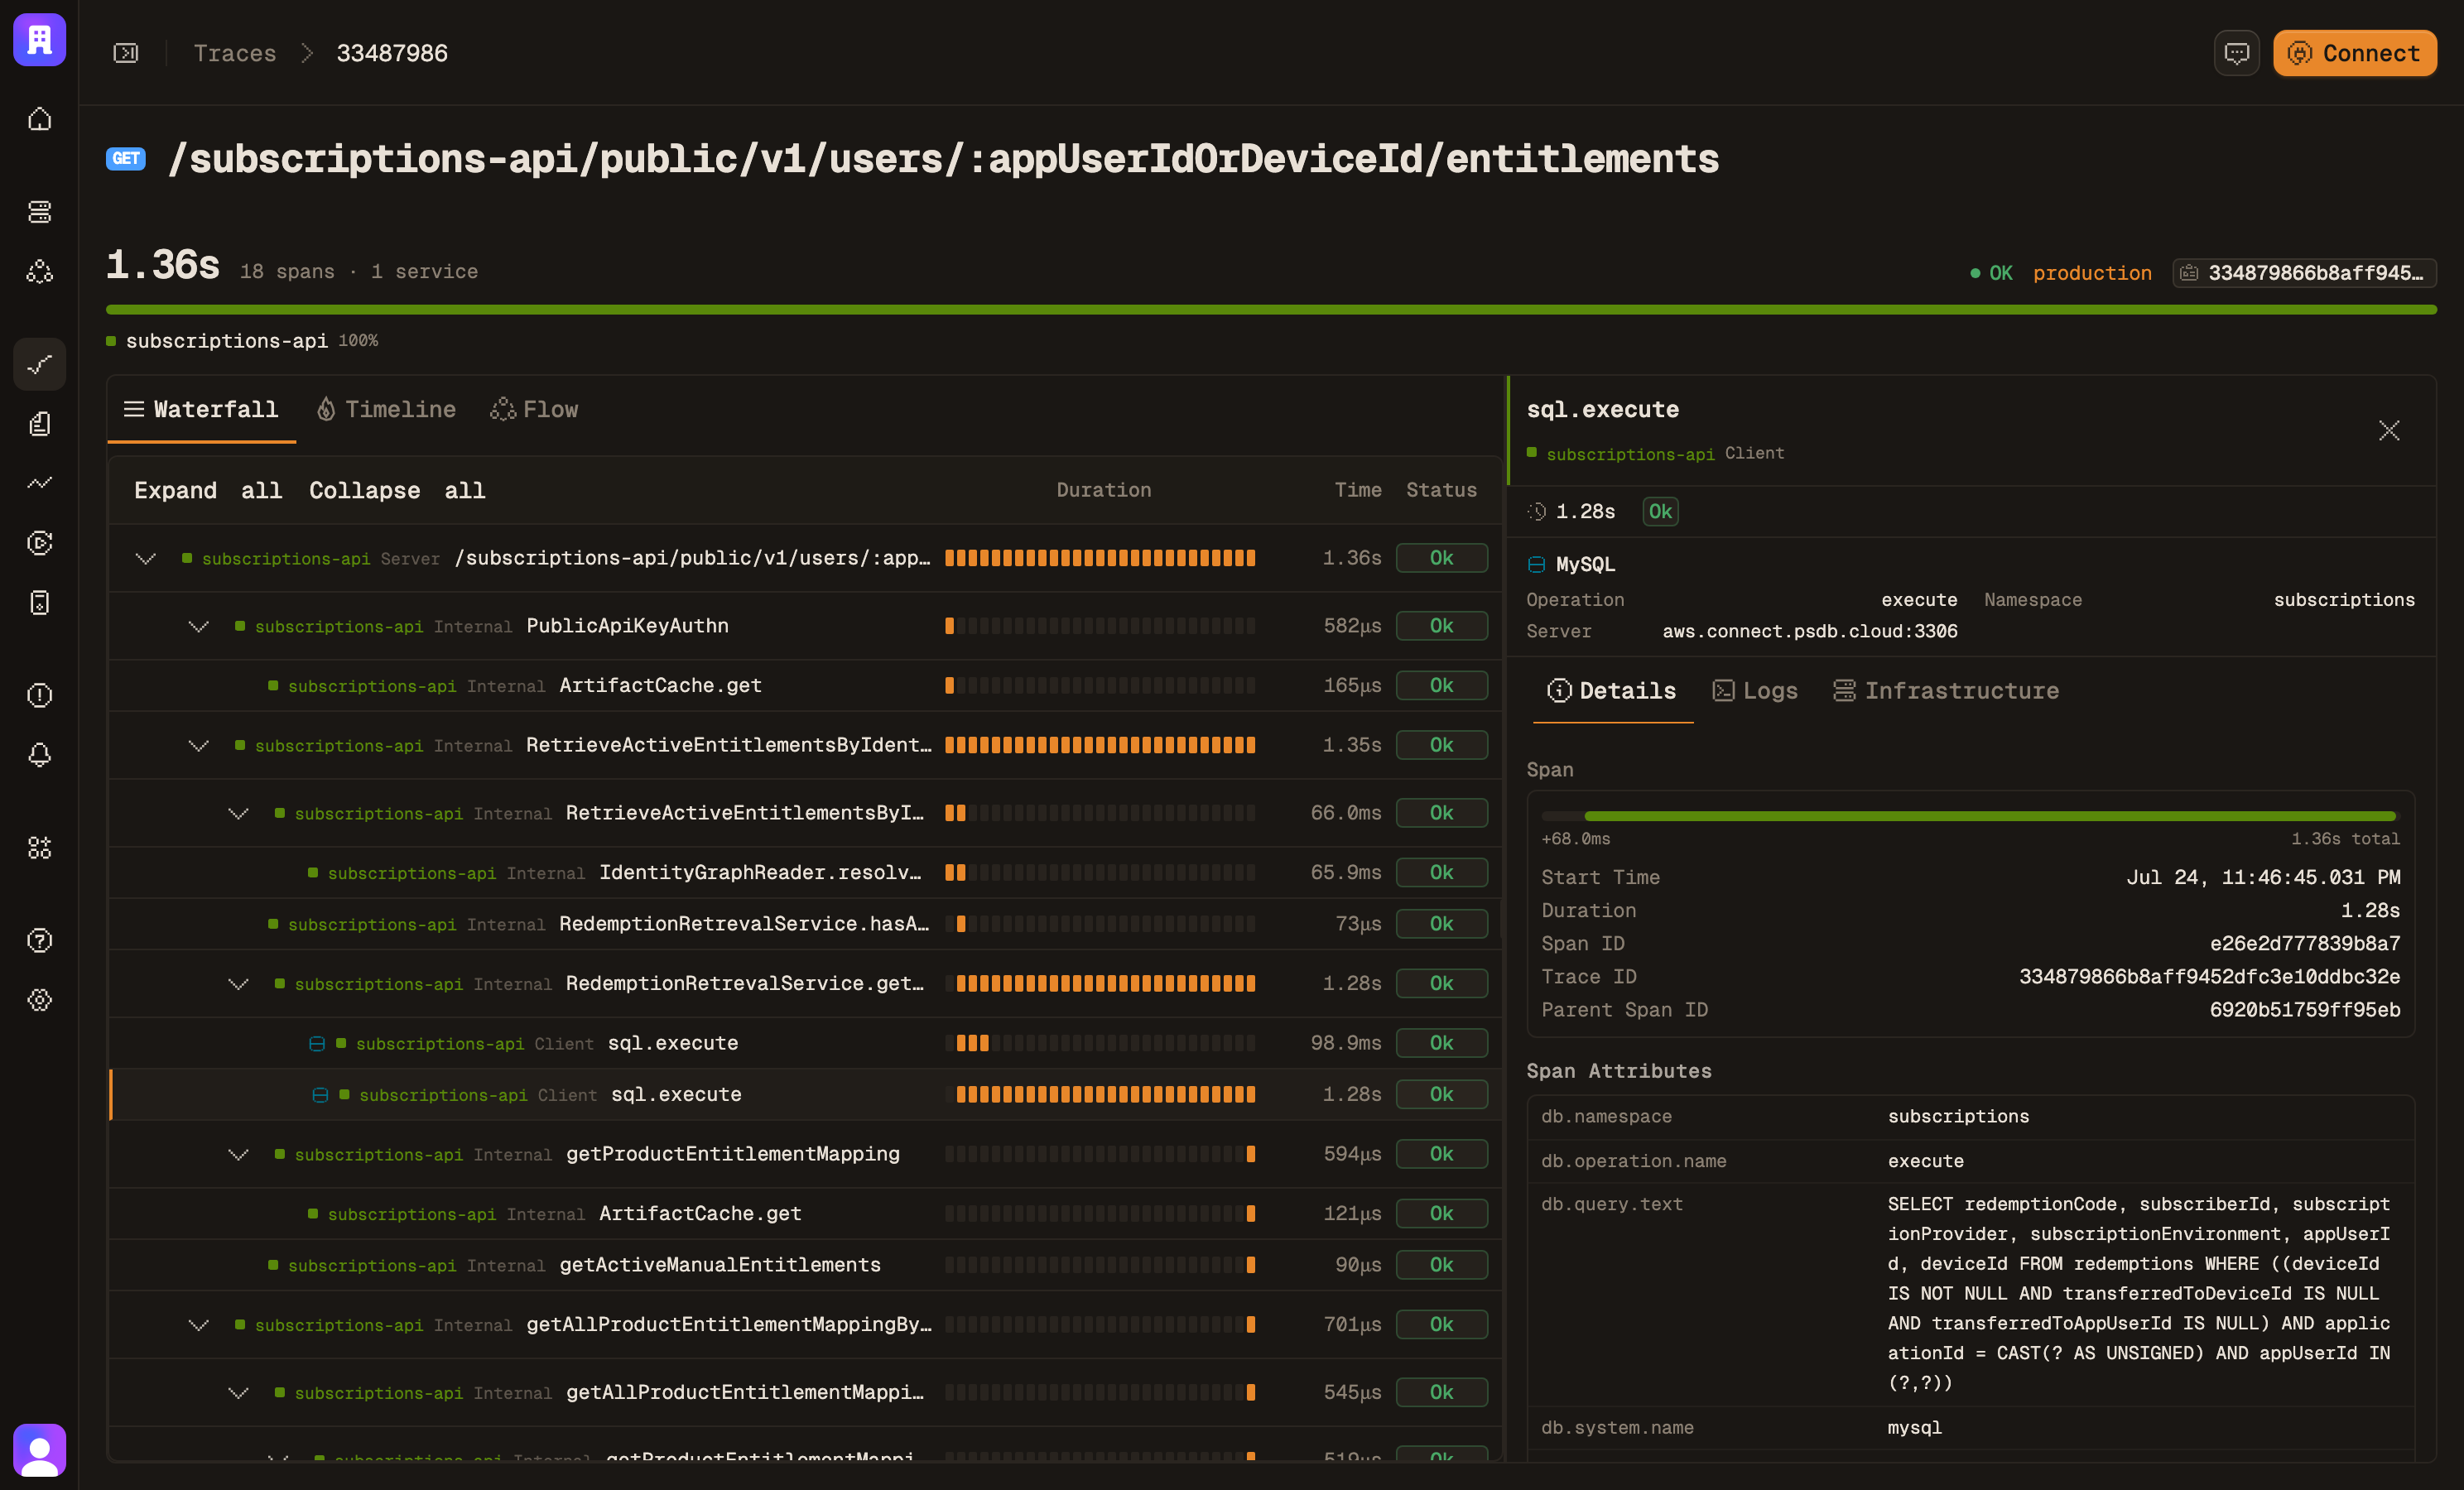
The trace shows the wait, not the work
Open a slow request and the db span is almost all of it. The query itself is 4 ms; the span is 210 ms. The difference is time spent before the query ever ran.
- logs T+2:40 · deploypayment-svc@1.4.2
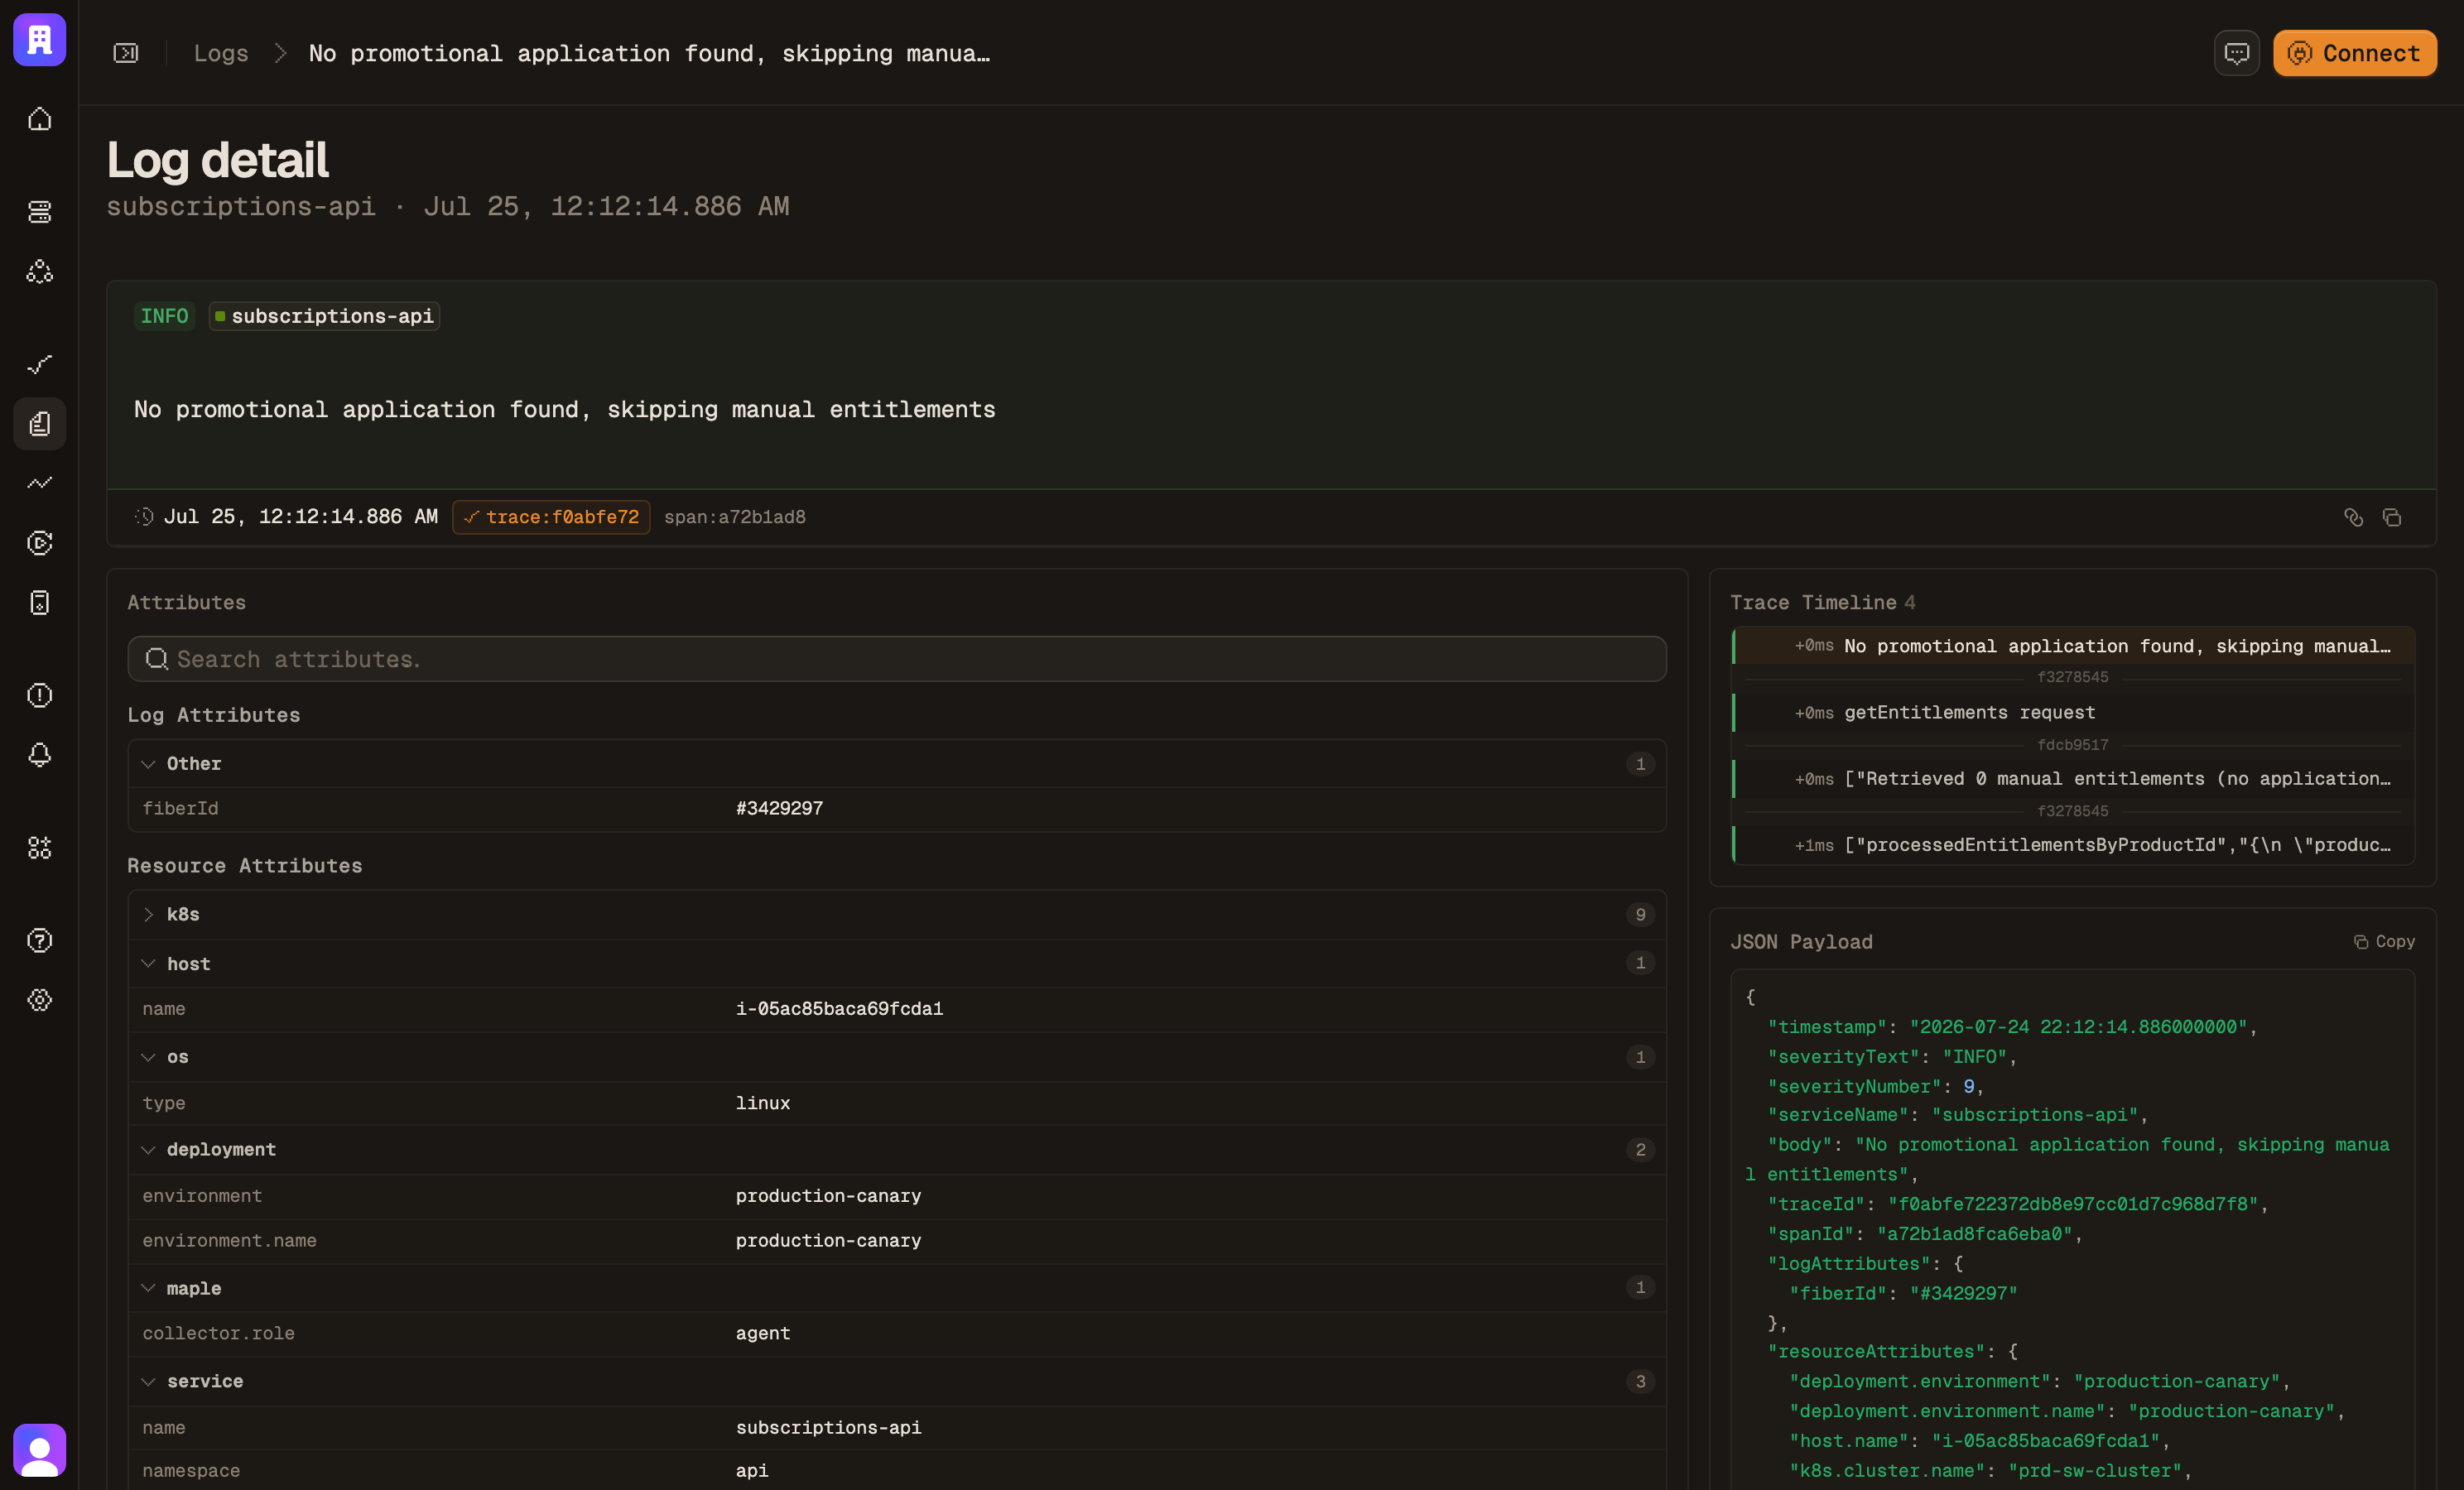
The logs name the release
Lines from that span read pool wait 206 ms, acquired after 3 attempts. Filter by service.version and they start at 1.4.2 — which raised concurrency without raising the pool.