
01 · Definition
Remote server monitoring, defined
You can't see or touch a cloud VM or a server in a branch office, so it has to report its own health and something has to tell you when that health goes wrong. Remote server monitoring is the software that does both: it collects CPU, memory, disk, network and log data from each server into one place, and alerts you when a number crosses a limit or a server stops reporting.
Without it, a full disk or a crashed VM stays broken until a user notices. This guide compares agent and agentless collection and the tools for each, lists the signals worth watching, sets up the OpenTelemetry Collector on each server, and ends with alerts, including one for a server that stops reporting.
Key takeaways
- An agent pushes data out over HTTPS on port 443 and needs no inbound port. A poller needs SSH, SNMP, WinRM or port 9100 open to it.
- Run an agent on servers you own, and poll only devices that can't run an agent.
- A dead server sends nothing, so one alert has to treat missing data as a breach.
- Full disks take servers down while CPU and memory look normal: alert on every writable mount above 90%.
02 · Collection
Agent-based vs agentless remote server monitoring
The two approaches differ in who opens the network connection, and that decides which ports have to be open on the server.
Solid arrows start at the side that opens the connection. Only the agent needs no inbound port on the server.
Agent: the server pushes its data out
An agent is a program that runs on each server, reads the kernel's counters in /proc and the log files, and sends them to a backend over HTTPS. Because the server opens the connection, it works from behind NAT, from a private subnet, or from a customer site you can't reach. It also sees what nothing outside can: usage per mount, per-process counts, and the log line where the kernel killed a process.
The cost is software on every server that you install, configure and upgrade. A server that dies sends nothing, so one alert has to watch for missing data: the heartbeat rule.
Agentless: a poller reaches in
Agentless monitoring runs on one central machine, the poller, which logs in or queries each server on a schedule. Nothing extra runs on the server, but every server has to accept a connection from the poller, and the poller holds credentials for all of them.
| Method | Connection opened by | Open on the server | Fits |
|---|---|---|---|
| OpenTelemetry Collector, or another agent | The server, outbound | Nothing | Linux and Windows servers you run |
| SSH polling | The poller | 22, plus an account | A few servers, one-off checks |
| SNMP | The poller | UDP 161 | Switches, firewalls, UPS units |
| WMI or WinRM | The poller | 135 and dynamic RPC, or 5985/5986 | Windows servers in a domain |
| Prometheus scrape of node_exporter | The scraper | 9100 | Fleets already on Prometheus |
For servers you run, use an agent. Keep polling for devices that can't run one. The OpenTelemetry Collector does both: host_metrics and file_log on the server, and snmp for network devices.
Remote server monitoring tools
| Tool | Type | License and price | Pick it if |
|---|---|---|---|
| OpenTelemetry Collector | Agent, plus SNMP polling, in one binary | Open source (Apache 2.0); sends to any OTLP backend | You want metrics and logs in an open format you can send anywhere |
| Zabbix | Agent plus SNMP and SSH polling | Open source (AGPL-3.0 since 7.0), paid support available | You want one self-hosted server for agents and network devices |
| Datadog | Agent with a hosted backend | Paid: Infrastructure Pro $15 per host per month, billed annually; free up to 5 hosts with 1-day retention. How Datadog pricing compares | You want nothing to host and per-host pricing fits your fleet |
| Nagios | Poller with plugins; NRPE and NCPA agents optional | Nagios Core free (GPL v2); Nagios XI from $2,595 for 100 nodes, one-time | You want its large plugin library |
| PRTG | Poller over SNMP, WMI and SSH | Paid by sensor: from $200 a month for 500 sensors, billed annually; free up to 100 sensors | You monitor Windows servers and network gear from one console |
| Prometheus + node_exporter | Poller metrics stack: Prometheus scrapes port 9100 | Open source (Apache 2.0) | You already run Prometheus and Grafana |
Prices from each vendor's pricing page, last verified October 31, 2026. This guide uses the Collector, with Maple as the example backend.
Why we believe in OpenTelemetry
- OpenTelemetry is open: an open-source, vendor-neutral standard for metrics, logs and traces. The Collector is licensed under Apache 2.0.
- An agent priced per host adds to the bill with every VM, container or small instance, which pushes you toward fewer, bigger servers. The Collector costs nothing to run, and the backend you choose prices the data, often by volume, so the agent doesn't decide how many servers you run.
- Switching vendors means changing the exporter endpoint in the Collector config. The servers and the instrumentation stay as they are.
- The project is mature: a graduated CNCF project since May 2026, supported by the major cloud providers and observability vendors.
03 · Signals
Signals to watch on a remote server
Each row names the OpenTelemetry metric the setup below collects and a first alert condition. Replay a week of data before you page anyone on a threshold.
| Signal | Collected as | Starting alert |
|---|---|---|
| Heartbeat | system.memory.utilization | No new points from the host for 5 minutes |
| CPU | system.cpu.utilization, system.cpu.load_average.15m | Above 90% for 15 minutes, or load above the core count |
| Memory | system.memory.utilization | Above 90% used, or OOM kills in the logs |
| Disk space | system.filesystem.utilization | Any writable mount above 90% |
| Network | system.network.errors, system.network.dropped | Errors or drops climbing |
| Processes | system.processes.count | Blocked processes piling up |
| Logs | file_log | Disk I/O errors, OOM kills, SSH auth failures |
Disk space and inodes
Disk is the signal most likely to take a remote server down while CPU and memory look normal. A log directory fills /var, the database can't write, and the service fails. Alert on every writable mount, including data volumes. Inodes run out too: a mount with free bytes and no free inodes rejects new files, and df -i shows it.
Check a remote server by hand over SSH
When an alert fires, a minute in a shell answers what a chart can't. These commands ship with most distributions:
uptime              # load average over 1, 5 and 15 minutes
top -o %CPU         # live, busiest process first (htop if installed)
vmstat 5 5          # five samples, 5 seconds apart
Load above the number of cores means work is queueing. In vmstat, a high r column is the same queue, and a high wa means the CPU is waiting on disk rather than busy.
free -h                           # used, available, swap
ps aux --sort=-%mem | head -5     # the biggest processes
vmstat 5 5                        # si and so: swapping in and out
Read available, not free: the kernel fills spare memory with cache and hands it back on demand. Non-zero si and so in vmstat mean the server is swapping.
df -h                                        # space per mount
df -i                                        # inodes per mount
du -xh /var --max-depth=1 | sort -h | tail   # what filled /var
iostat -xz 5 3                               # per-device load (sysstat package)
A device near 100 in %util with rising r_await or w_await is saturated. iostat comes with the sysstat package.
ss -tulpn          # listening ports and the process behind each
ss -s              # connection counts by state
ip -s link         # bytes, errors and drops per interface
Thousands of connections in timewait point at a client opening a new connection per request. Errors or drops that keep rising in ip -s link point at the link or the driver.
journalctl -p err -b                      # errors since the last boot
journalctl -k -p err --since today        # kernel errors: disks, OOM kills
journalctl -u nginx --since "1 hour ago"  # one service
Most distributions log through the journal. On systems with rsyslog, the same lines are in /var/log/syslog or /var/log/messages.
For a quick pass over a few servers during an incident:
for h in web-01 web-02 db-01; do
  ssh "$h" 'echo "== $(hostname)"; uptime; df -h / | tail -1'
done
A loop like this keeps no history and runs only while you watch, so it can't replace the setup below.
04 · Hands-on
Set up remote server monitoring with the OpenTelemetry Collector
The OpenTelemetry Collector is an open-source program that receives, processes and exports telemetry. Its Contrib distribution, otelcol-contrib, includes every receiver this guide uses. It runs as the agent on each Debian, Ubuntu or RHEL-family server and sends OTLP to Maple, the example backend in this guide. Any backend that accepts OTLP works the same way with its own endpoint and key. Every config here was run on release 0.163.1.
1. Install the Collector on each server
# Debian and Ubuntu
curl -LO https://github.com/open-telemetry/opentelemetry-collector-releases/releases/download/v0.163.1/otelcol-contrib_0.163.1_linux_amd64.deb
sudo dpkg -i otelcol-contrib_0.163.1_linux_amd64.deb

# RHEL, Rocky, Alma, Fedora
curl -LO https://github.com/open-telemetry/opentelemetry-collector-releases/releases/download/v0.163.1/otelcol-contrib_0.163.1_linux_amd64.rpm
sudo rpm -ivh otelcol-contrib_0.163.1_linux_amd64.rpm
Use the arm64 package on ARM servers, and the current version from the releases page. The package creates an unprivileged otelcol-contrib user, a systemd unit that runs as that user, and /etc/otelcol-contrib/ with config.yaml and an environment file, otelcol-contrib.conf, which the unit reads at start.
2. Configure the agent
Replace /etc/otelcol-contrib/config.yaml with:
config.yaml on each server
receivers:
    host_metrics:
        collection_interval: 30s
        scrapers:
            cpu:
                metrics:
                    system.cpu.utilization:
                        enabled: true
            load: {}
            memory:
                metrics:
                    system.memory.utilization:
                        enabled: true
            filesystem:
                metrics:
                    system.filesystem.utilization:
                        enabled: true
            network: {}
            processes: {}
    file_log:
        include:
            - /var/log/syslog
            - /var/log/auth.log
        start_at: end

processors:
    resource_detection:
        detectors: [env, system]
    resource/logs:
        attributes:
            - key: service.name
              value: system-logs
              action: upsert
    batch: {}

exporters:
    otlp_http/maple:
        endpoint: https://ingest.maple.dev
        compression: gzip
        headers:
            x-maple-ingest-key: ${env:MAPLE_INGEST_KEY}

service:
    pipelines:
        metrics:
            receivers: [host_metrics]
            processors: [resource_detection, batch]
            exporters: [otlp_http/maple]
        logs:
            receivers: [file_log]
            processors: [resource_detection, resource/logs, batch]
exporters: [otlp_http/maple]host_metricsreads CPU, load, memory, filesystems, network and process counts every 30 seconds. The three*.utilizationmetrics are off by default and are the ones the Maple Hosts page reads.file_logtails the system logs from the end, so a restart doesn't resend old lines. They arrive unparsed under the servicesystem-logs. RHEL-family systems use/var/log/messagesand/var/log/secure, and Debian 12 writes only to the journal unlessrsyslogis installed, so list the files that exist.resource_detectionsetshost.name,os.typeandhost.arch. Itsenvdetector readsOTEL_RESOURCE_ATTRIBUTES, so per-server values go in the environment file andconfig.yamlstays the same on every server.- EU organizations use
https://ingest.eu.maple.dev.
Older Collector releases
Releases before the component rename call these hostmetrics, filelog, resourcedetection and otlphttp. Release 0.163.1 still accepts the old names and logs a deprecation warning for each.
3. Add the key and start the service
Put the backend's ingest key in /etc/otelcol-contrib/otelcol-contrib.conf. In Maple, that is the private ingest key (maple_sk_…) from Settings → Ingestion:
OTELCOL_OPTIONS="--config=/etc/otelcol-contrib/config.yaml"
MAPLE_INGEST_KEY=maple_sk_...
OTEL_RESOURCE_ATTRIBUTES=deployment.environment.name=production
Then make that file readable by root only, let the service user read /var/log (on Debian and Ubuntu the log files belong to the adm group), and start the service:
sudo chmod 600 /etc/otelcol-contrib/otelcol-contrib.conf
sudo usermod -aG adm otelcol-contrib     # read access to /var/log
sudo systemctl enable otelcol-contrib
sudo systemctl restart otelcol-contrib
journalctl -u otelcol-contrib -f
systemd reads the environment file as root before it drops to the service user, so the key never sits in config.yaml. A 401 in the journal means the key is wrong. On RHEL-family systems the log files are readable by root only and the adm step doesn't apply: give otelcol-contrib read access with an ACL, or leave file_log out.
Many servers, one config
A backend lists each distinct host.name as its own host. A VM cloned from an image that kept its hostname merges two servers into one row, and a rename splits one into two. Pin the name in the environment file, where the env detector reads it before the system detector looks at the OS. With Ansible, template otelcol-contrib.conf:
OTELCOL_OPTIONS="--config=/etc/otelcol-contrib/config.yaml"
MAPLE_INGEST_KEY={{ maple_ingest_key }}
OTEL_RESOURCE_ATTRIBUTES=host.name={{ inventory_hostname }},deployment.environment.name={{ env_name }}
Ship config.yaml unchanged, deploy the environment file with mode 0600, restart the service when either changes, and pin the package version in the same playbook so an upgrade is one change you can roll back.
05 · Example
Example: remote servers on the Maple Hosts page
Maple is the example backend here. Any backend that receives OpenTelemetry host metrics can show the same data; the menus differ.
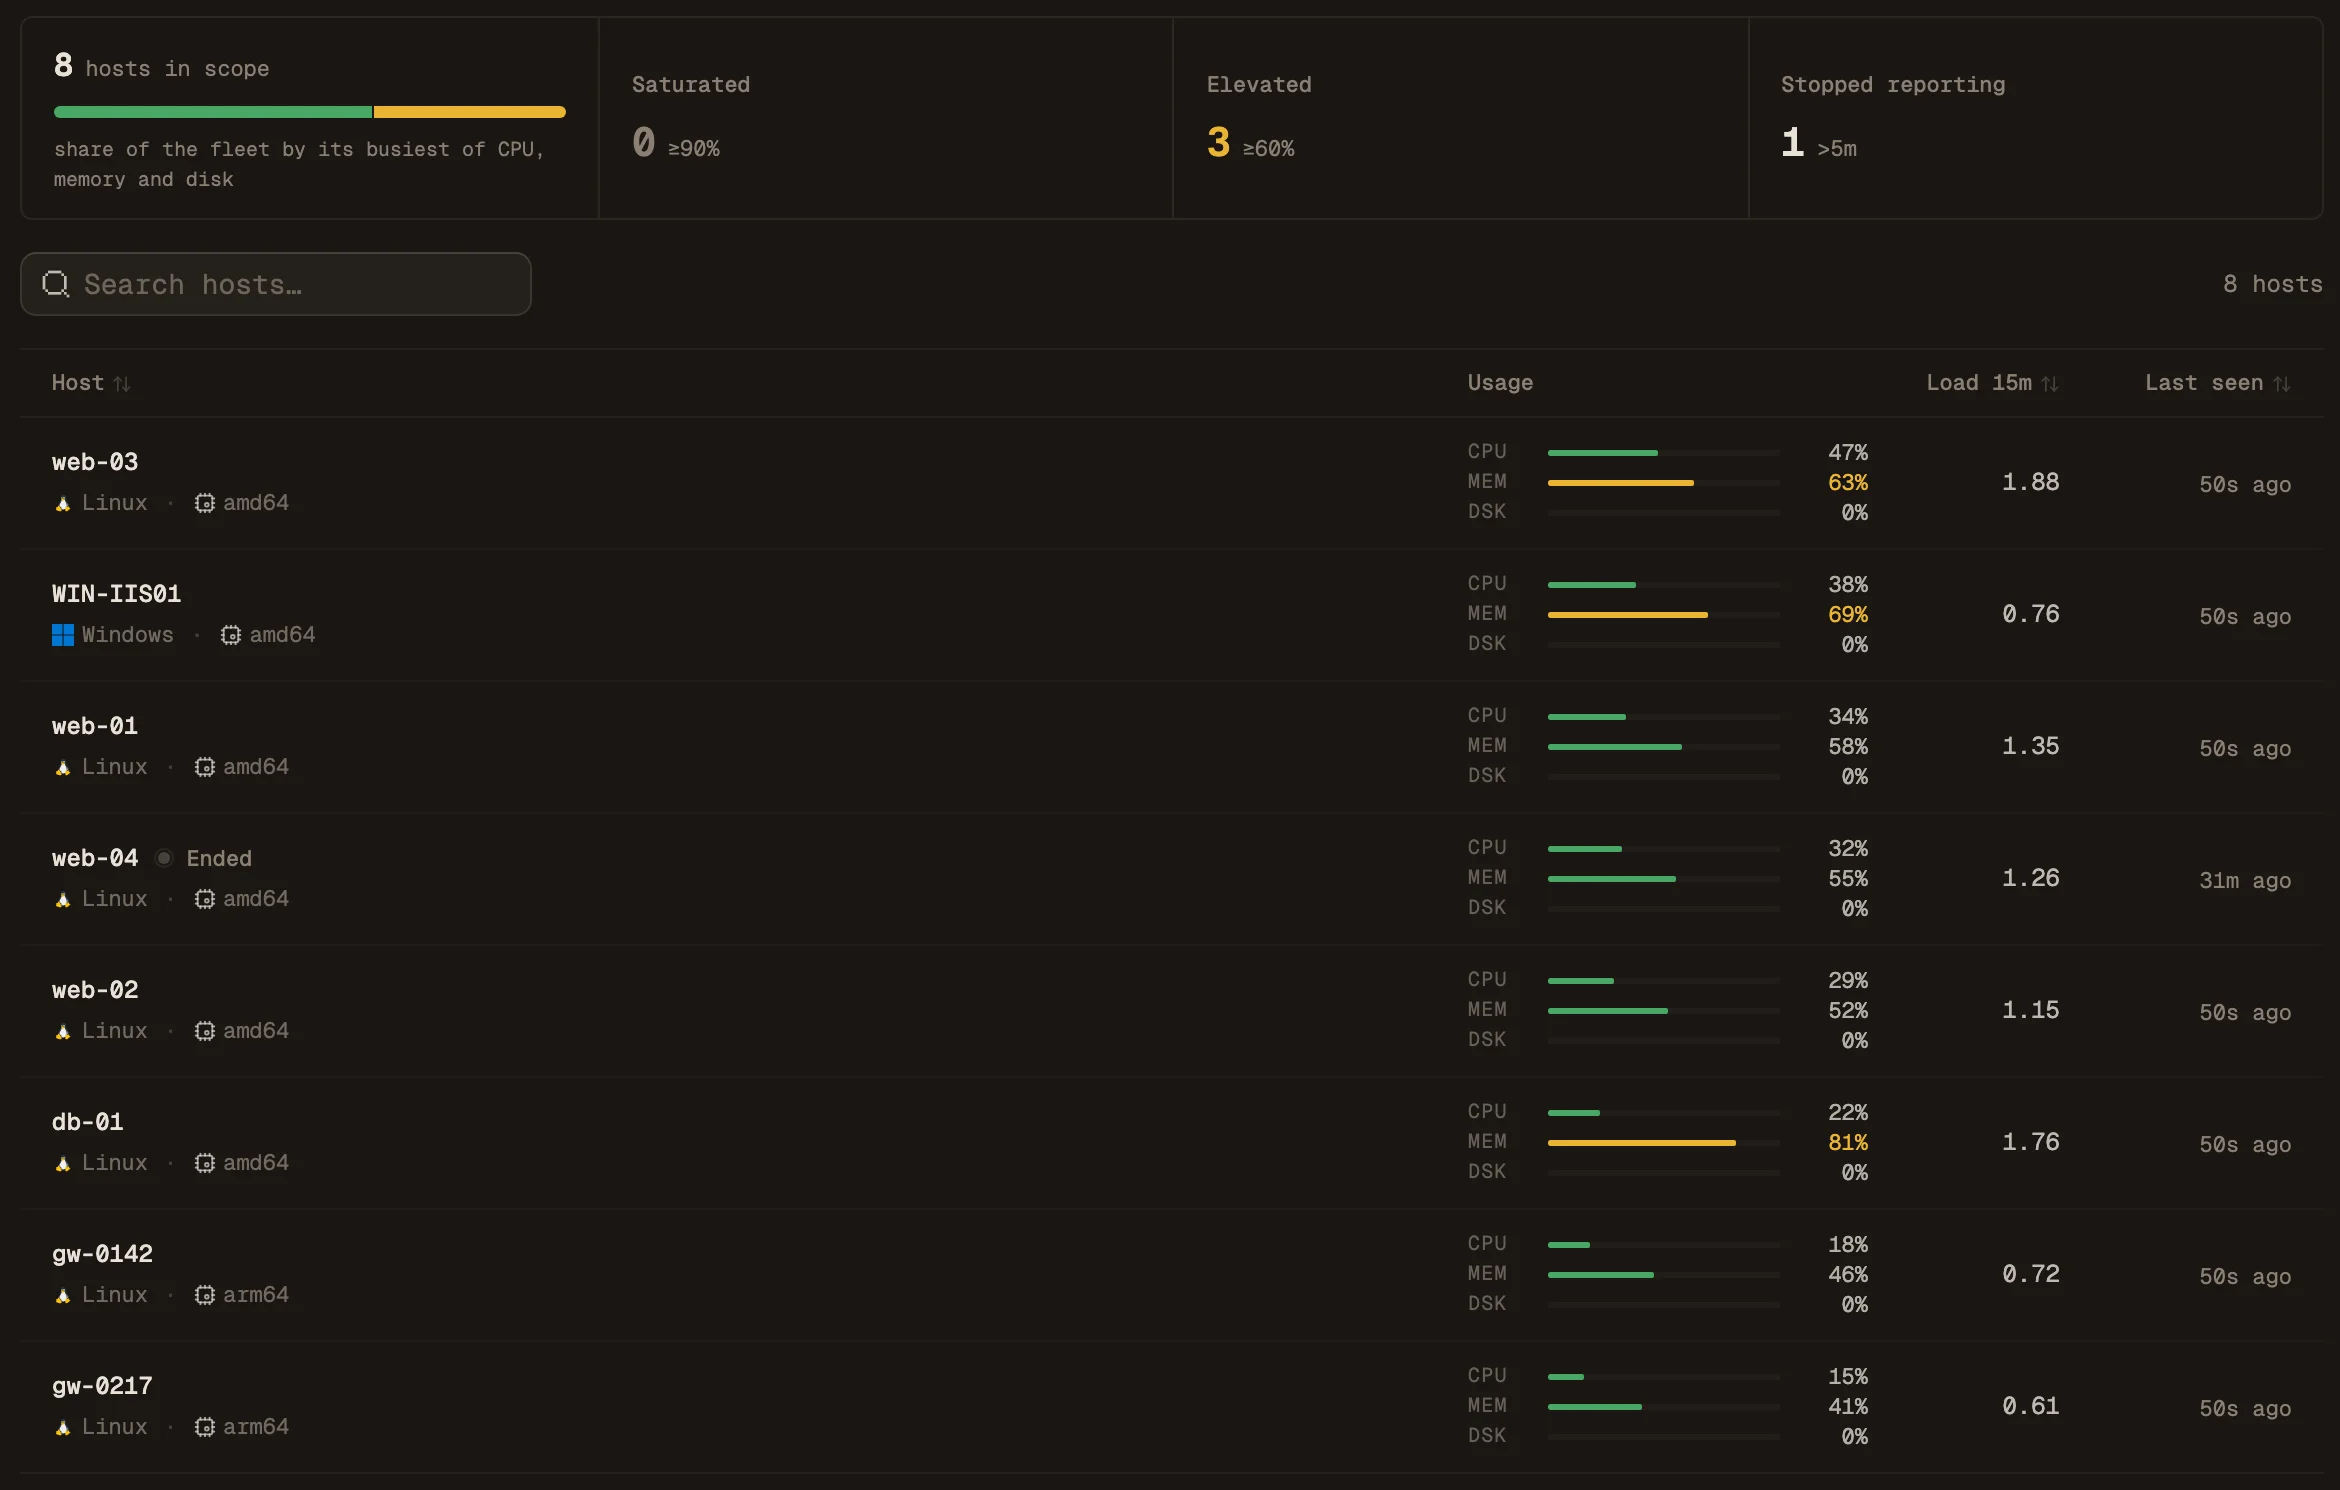
In Maple, open Infrastructure → Hosts. A server appears within about a minute of its agent starting. The list shows each host's status, CPU, memory and disk usage, 15-minute load and last report, and you can filter it by status to find the servers that went quiet:
| Status | Last report |
|---|---|
| Active | Less than 1 minute ago |
| Idle | Between 1 and 5 minutes ago |
| Ended | 5 minutes or more ago |
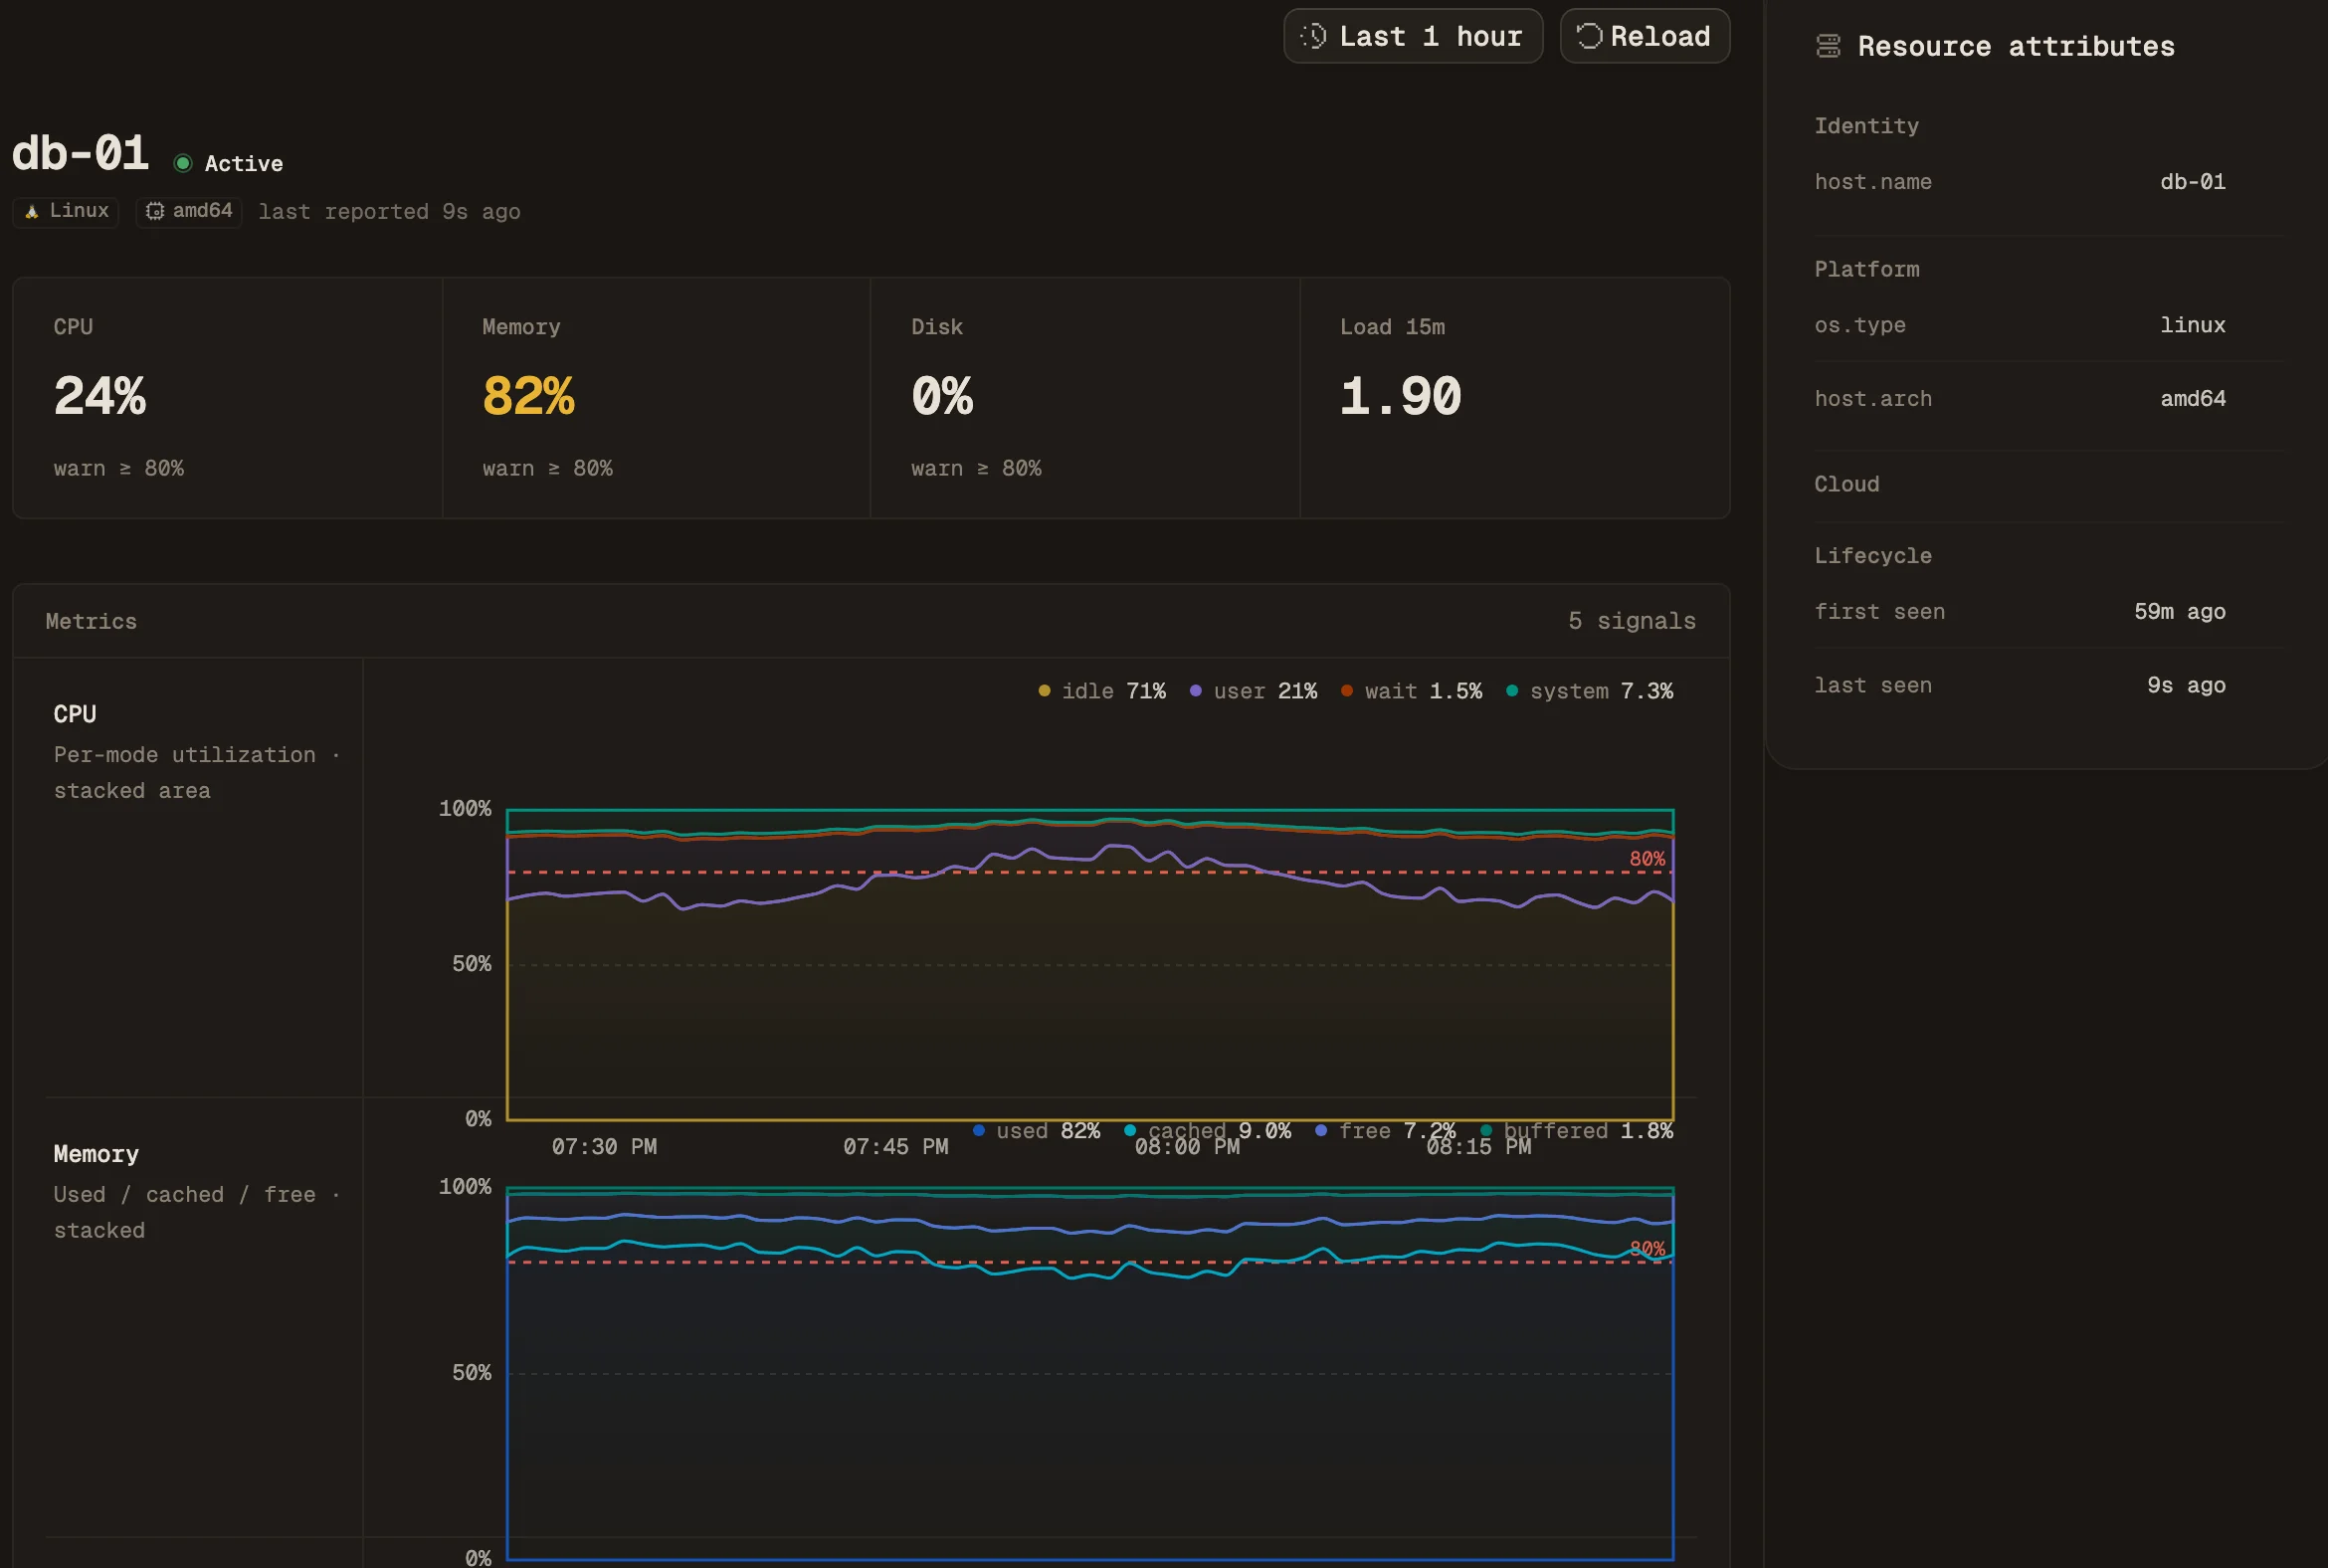
Click a host for CPU, memory, filesystem per mount, network per interface and load over time, next to its os.type and host.arch. Add the ec2, gcp or azure detector to resource_detection and the page also shows cloud.provider and cloud.region.
The system logs are on the Logs page under the service system-logs. For Windows servers, the Windows server monitoring guide sets up the same Collector.
Set it up in Maple
Send host metrics
The Hosts docs list each metric the page reads and the fixes for a missing host or zero readings.
06 · Alerts
Alert when a remote server goes down or quiet
Any backend that receives OpenTelemetry data can alert on these metrics, including on missing data; Maple is the example here. A Maple alert rule checks a value every minute and opens an incident after two breaching checks in a row. A server that stops sending leaves empty windows, which rules skip unless Alert when there is no data is on. That switch doesn't apply to rules split into one incident per group, so the heartbeat gets its own rule.
The rules below use the SQL signal on the metrics_gauge table (SQL reference). Open Alerts, click New rule, choose Start blank, and set the signal to SQL.
Heartbeat rule per server
SELECT $__timeGroup(TimeUnix) AS bucket, count() AS value
FROM metrics_gauge
WHERE $__orgFilter AND $__timeFilter(TimeUnix)
  AND MetricName = 'system.memory.utilization'
  AND ResourceAttributes['host.name'] = 'web-01'
GROUP BY bucket- 01
Threshold
Reduce each window by Sum, Alert when the value is below, Threshold
1. - 02
How it is checked
Window 5 min and Minimum samples 1. The default of 50 would skip every check.
- 03
No data
Switch Alert when there is no data on, so a quiet
web-01counts as a breach.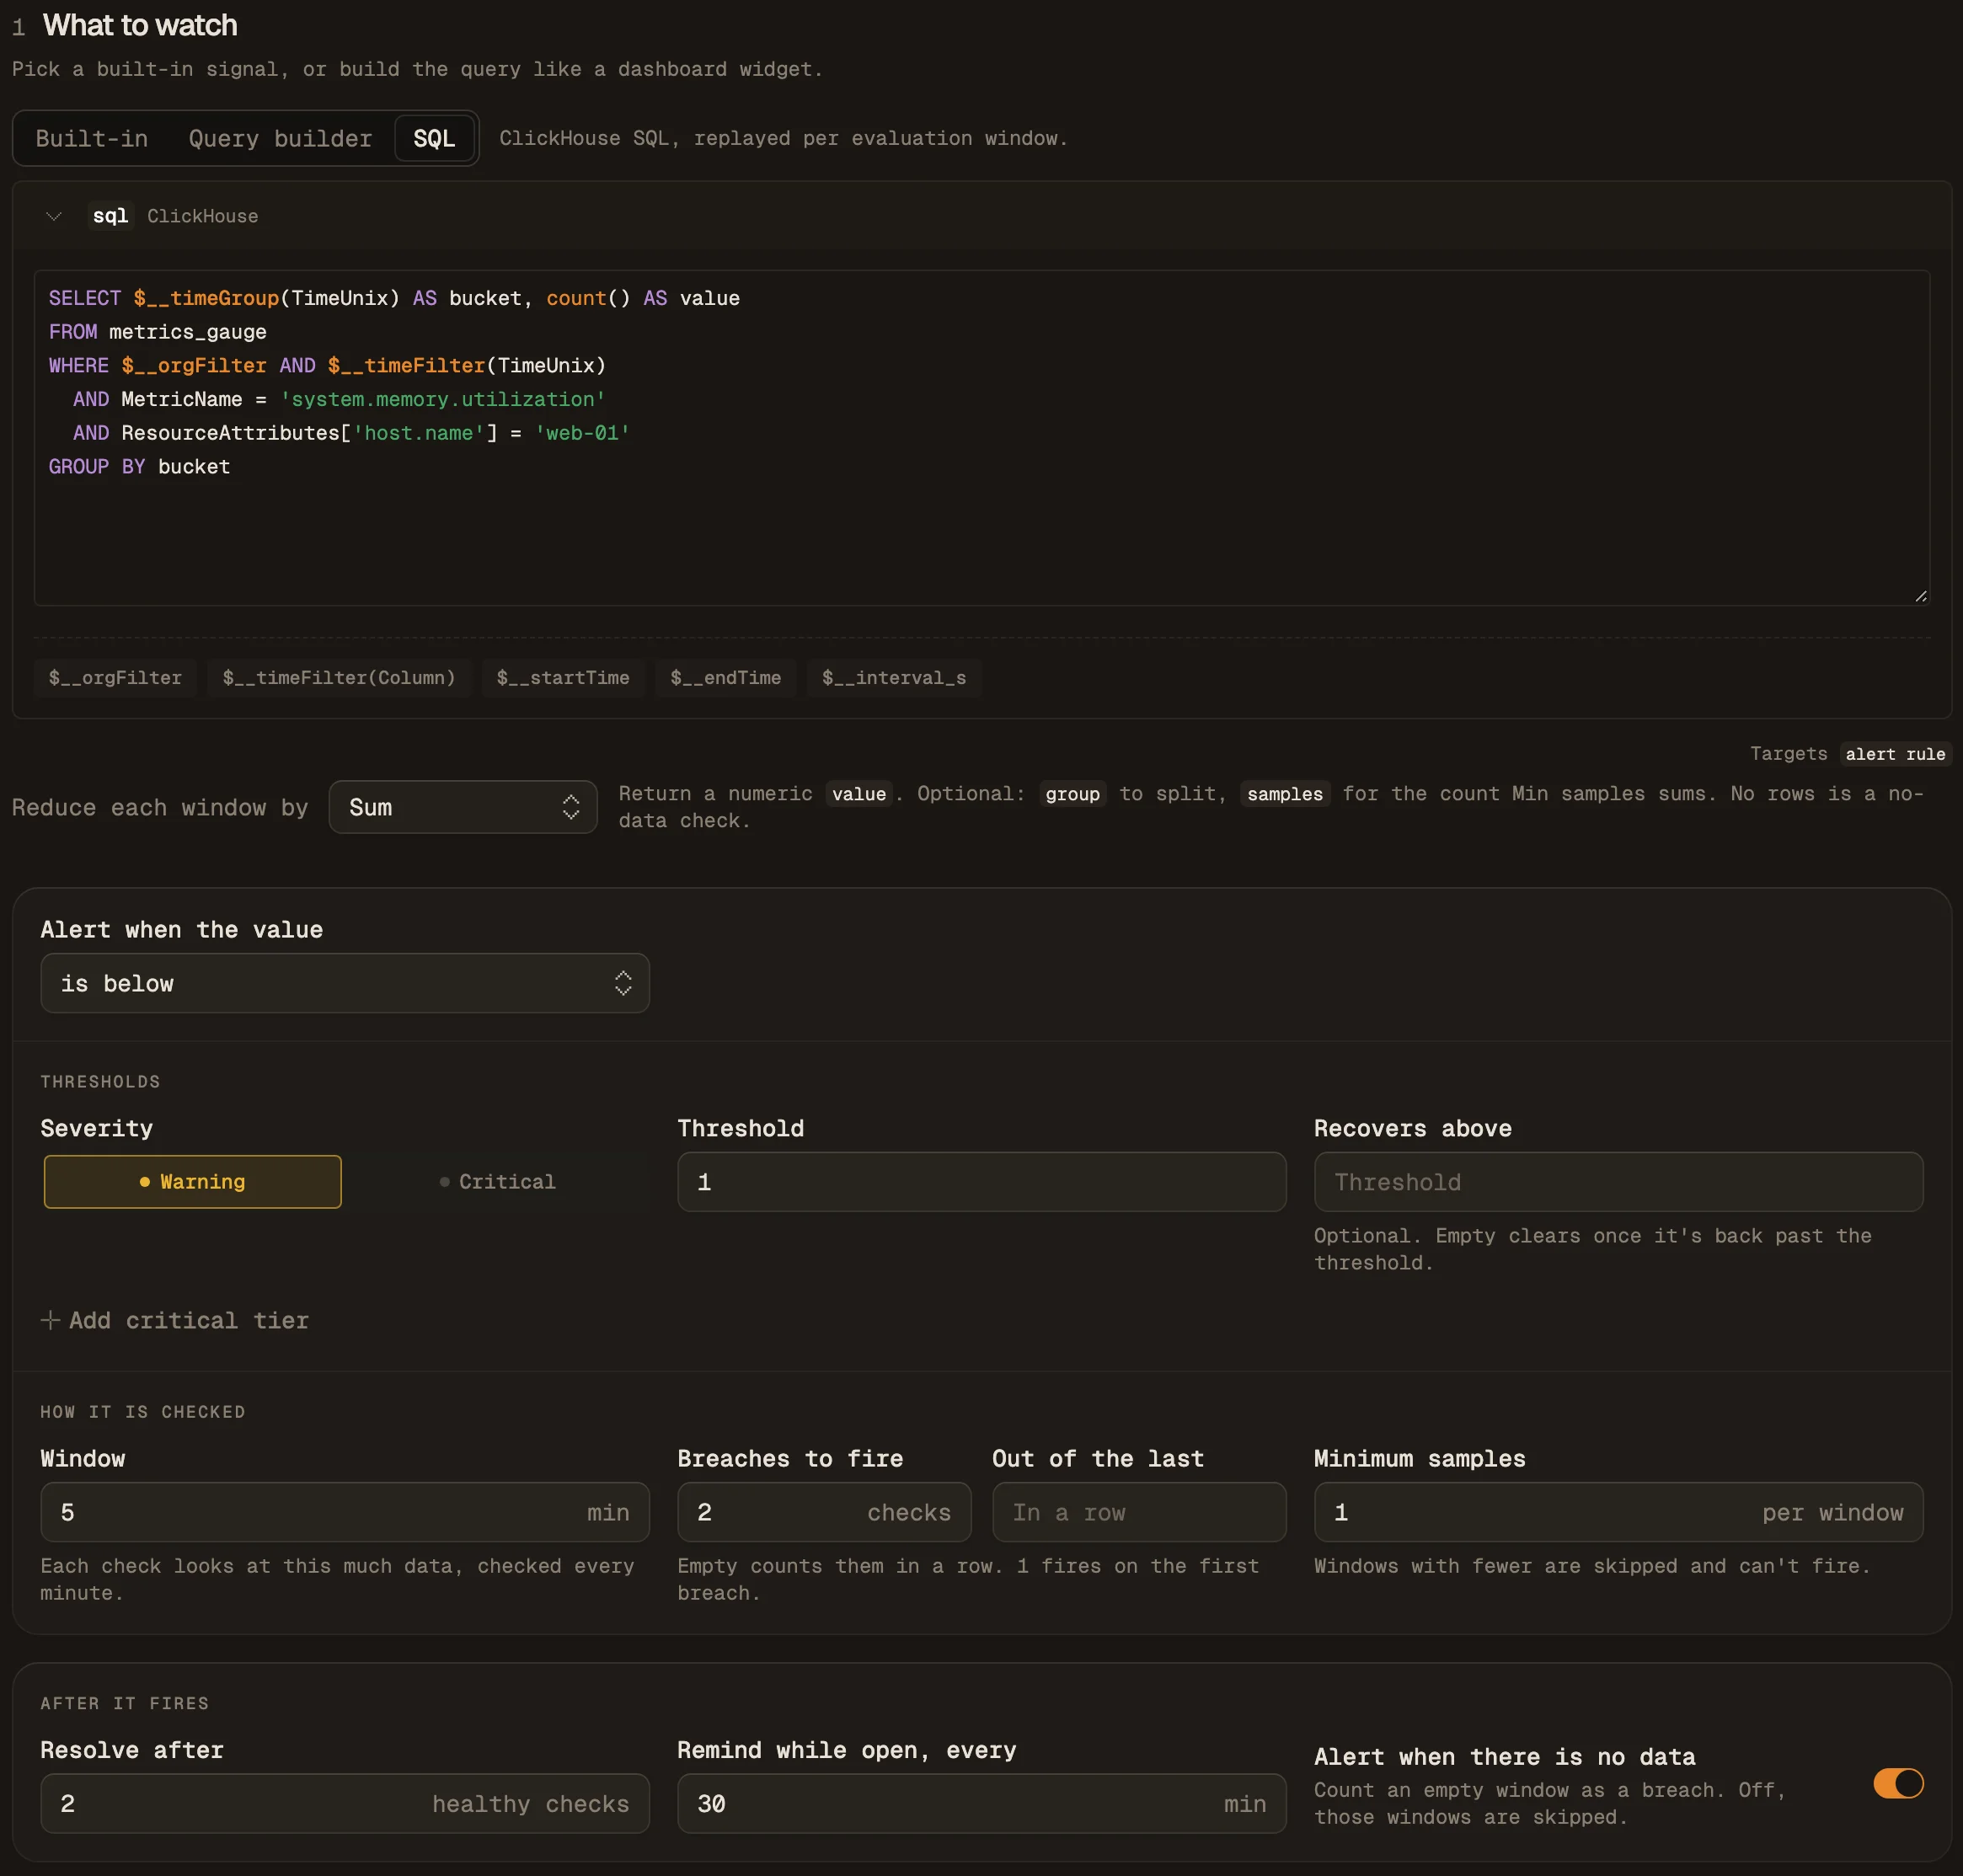
The incident opens six to seven minutes after the server's last report. Create one rule per server from your config management with the alert rules API.
One rule for the whole fleet
Count the hosts that reported instead, and fire when the count drops below the fleet size:
SELECT $__timeGroup(TimeUnix) AS bucket,
       uniqExact(ResourceAttributes['host.name']) AS value
FROM metrics_gauge
WHERE $__orgFilter AND $__timeFilter(TimeUnix)
  AND MetricName = 'system.memory.utilization'
GROUP BY bucket
Set Reduce each window by Minimum, Alert when the value is below, Threshold the number of servers, Minimum samples 1, and Alert when there is no data on. The Hosts page filtered to Ended shows which server went quiet. Raise the threshold when you add a server.
Disk, memory and CPU per host
Threshold rules don't need the no-data switch, so one rule covers every server. Return a group column and Maple opens one incident per host. Set Reduce each window by Maximum and Minimum samples 1; utilization is a ratio from 0 to 1.
SELECT $__timeGroup(TimeUnix) AS bucket,
       ResourceAttributes['host.name'] AS group,
       max(Value) AS value
FROM metrics_gauge
WHERE $__orgFilter AND $__timeFilter(TimeUnix)
  AND MetricName = 'system.filesystem.utilization'
  AND Attributes['mode'] = 'rw'
GROUP BY bucket, group
Window 5 min, Alert when the value is above, Threshold 0.9. The fullest writable mount on each host. mode = 'rw' drops read-only mounts such as snap images, which always read 100%.
SELECT $__timeGroup(TimeUnix) AS bucket,
       ResourceAttributes['host.name'] AS group,
       max(Value) AS value
FROM metrics_gauge
WHERE $__orgFilter AND $__timeFilter(TimeUnix)
  AND MetricName = 'system.memory.utilization'
  AND Attributes['state'] = 'used'
GROUP BY bucket, group
Window 5 min, Alert when the value is above, Threshold 0.9. The metric has one point per state (used, free, cached, buffered and slab), so filter to used.
SELECT $__timeGroup(TimeUnix) AS bucket,
       ResourceAttributes['host.name'] AS group,
       1 - avg(Value) AS value
FROM metrics_gauge
WHERE $__orgFilter AND $__timeFilter(TimeUnix)
  AND MetricName = 'system.cpu.utilization'
  AND Attributes['state'] = 'idle'
GROUP BY bucket, group
Window 15 min, Alert when the value is above, Threshold 0.9. Busy time is one minus idle time. The longer window keeps short spikes, such as a nightly backup, from paging.
Click Test rule before you save: the preview replays the rule over a past range and shades the periods where it would have fired. Incidents covers what happens next, from notifications to resolution.
Sources and further reading
- OpenTelemetry Collector Contrib: Host Metrics receiver
- OpenTelemetry Collector Contrib: File Log receiver
- OpenTelemetry Collector Contrib: Resource Detection processor
- OpenTelemetry Collector releases
- CNCF: OpenTelemetry project page
- Maple docs: Hosts
- Maple docs: Alert rules
- Maple docs: SQL reference