
01 · Definition
Uptime monitoring probes an endpoint from outside on a schedule
Uptime monitoring sends a scheduled request to a public endpoint from outside your infrastructure and records whether it answered. A check asserts an HTTP status and usually a response time limit. When enough consecutive checks fail, it notifies someone.
The same tools watch the days left until the TLS certificate expires and whether the DNS record resolves. Hosted products run each check from several regions, so a network problem near one prober does not page you.
Availability as a number
The result is reported as availability: the time the endpoint answered, divided by the total time. Each added nine cuts the downtime you are allowed by a factor of ten.
| Availability | Downtime allowed in 30 days |
|---|---|
| 99% | 7 h 12 min |
| 99.9% | 43 min 12 s |
| 99.95% | 21 min 36 s |
| 99.99% | 4 min 19 s |
Detection time comes out of that allowance. A probe that runs every 60 seconds and needs two failed checks before it alerts takes up to two minutes to notice an outage. Against a 99.99% target, that is close to half the month's allowance spent before anyone is paged.
02 · Coverage
A passing uptime check covers one URL once a minute
A probe proves that a single request to a single URL succeeded. Most teams point it at /health, which returns 200 for as long as the process is running.
Take a service that handles 10 requests per second. A deploy makes 2% of them fail. Over a day the service fails 17,280 real requests, while the probe on /health sends 1,440 requests and every one of them passes.
Pointing the probe at the broken route does not change much. Each check has a 2% chance of failing, so two consecutive failures come up about once in 2,500 pairs of checks. At one check a minute, the alert fires roughly every 42 hours while the incident fails 12 requests a minute.
A healthy status code from an unhealthy service
A health endpoint that returns 200 while the database is unreachable passes every check. Asserting on the response body narrows that gap, and the probe still tests only the path you scripted.
03 · Real traffic
Traces turn every real request into an availability check
A service instrumented with OpenTelemetry records a span for every request it handles, with a duration and a status. That is the same pass or fail result a probe produces, recorded for every route and every real user.
Signals to alert on
The share of requests that ended in an error. It catches the partial failure a probe samples past.
The number of requests in the window. When a service stops answering, its spans stop, and a drop to zero is the outage alert.
The share of requests that were fast enough and succeeded. It catches the outage where every response is still a 200 and takes four seconds. See What is Apdex?
Because the alert is computed from spans, the failing traces are already stored when it fires. A failed probe gives you a URL and a timestamp.
Failures compared: outside probe and trace alerts
| Failure | Probe on /health | Alerts on traces |
|---|---|---|
| 2% of checkout requests return 500 after a deploy | Passes | Error rate fires |
| A dependency slows every request to 4 s | Passes, unless it has a latency limit | Apdex and p95 fire |
| The process crashes and the load balancer returns 502 | Fails | Throughput drops to zero and fires |
| The TLS certificate expires | Fails, and can warn weeks ahead | Throughput drops after expiry and an alert fires |
| A DNS change points the domain nowhere | Fails | Throughput drops and an alert fires |
| An outage at 3am on a service with no night traffic | Fails | Nothing to measure |
| Users in one region cannot reach you | Fails only from a prober in that region | A partial dip, often under the threshold |
Alerts Alerts in some cases Stays silent
A probe misses the common incidents: partial errors and slowdowns inside the application.
Traces have a narrower gap. They cannot see a failure that happens before the request reaches your code, and they have nothing to measure when no requests arrive.
04 · Outside probes
Failures only an outside uptime probe can see
Our position is that uptime monitoring is a narrow tool that gets bought by default. It is often the first monitoring a team sets up, because it takes a URL and five minutes. It then stays in place long after the service has outgrown what one request a minute can describe.
The cost is a false sense of security. A status board that shows 100% for the month proves that /health answered 43,200 times. It is easy to read that as proof the service was healthy, and the 2% of failed requests from the earlier example never appear on it. A team that relies on the board alone hears about that incident from its users.
A probe is the right addition when one of these applies:
Traffic is low or stops overnight
With no requests there are no spans. A probe generates the traffic the alert needs.
Certificates and DNS
An expiry date is known weeks ahead, and only something that reads the certificate can warn you before it passes.
Edge, CDN and load balancer failures
A request rejected in front of your service never produces a span.
Reachability by region
A routing or resolver problem in one region takes probers in several regions to see, each with its own DNS resolution.
Evidence for an SLA
Customers and contracts often expect an availability figure measured by a third party, or a public status page.
Endpoints you do not instrument
A vendor API or a legacy service with no telemetry can still be probed.
05 · In Maple
Availability alerts from traces in Maple
Maple alerts on the traces your services already send, and it accepts check results from the OpenTelemetry Collector as metrics. It does not run hosted probes of its own.
The uptime monitoring docs walk through each rule below with screenshots.
- 01
Alert on traffic stopping
A Throughput drop rule scoped to a service fires when its request count falls below a threshold. A window with no requests counts as zero, so a full outage fires it.
- 02
Alert on failing requests
A High error rate rule fires above 5% over five minutes, and opens one incident per failing service.
- 03
Alert on slow requests
A Low Apdex score rule scores errors and slow requests together against a 500ms target.
- 04
Replay the rule against last week
The rule form replays a rule over a past range and shades the periods where it would have held an incident open. A threshold that would have fired on a normal Tuesday needs to move.
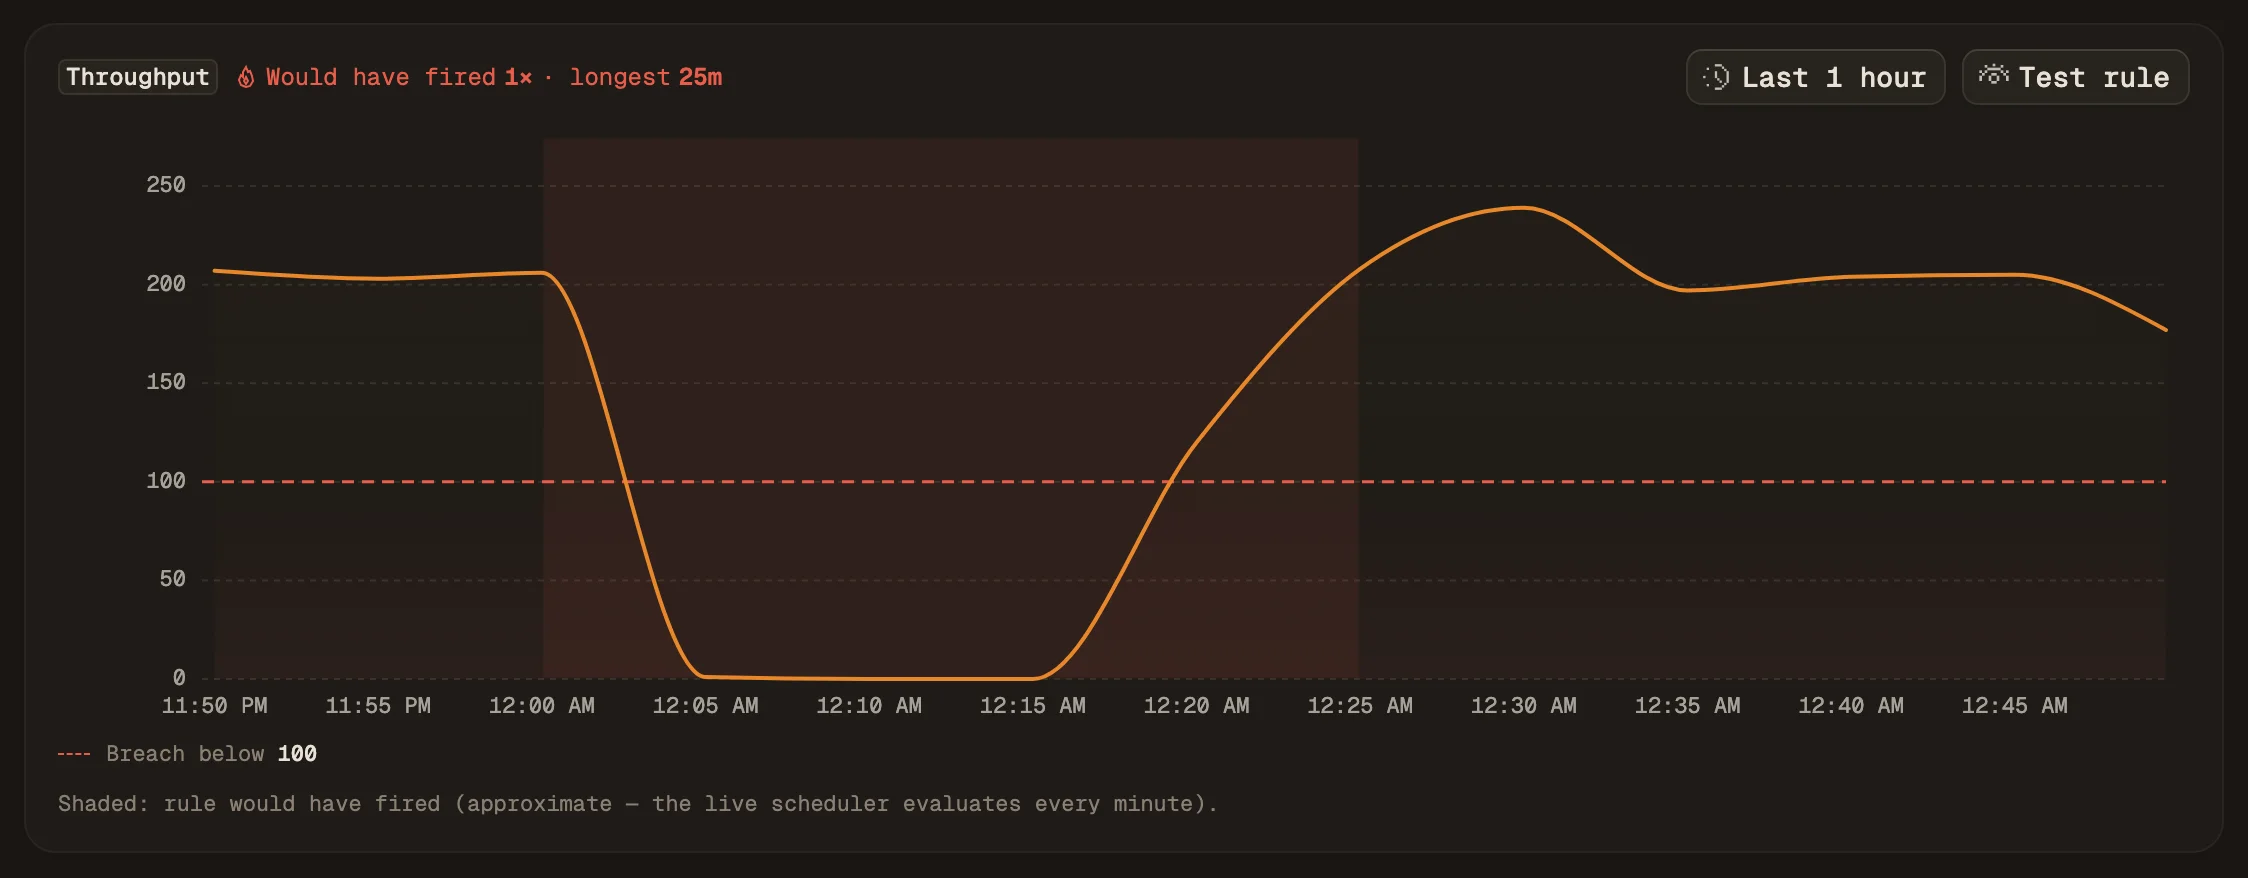
A throughput rule needs traffic to drop from. For a service that sits idle for hours, use an HTTP check instead.
06 · HTTP checks
HTTP uptime checks with the OpenTelemetry Collector
For the endpoints that need a probe, the Collector's http_check receiver requests a list of URLs on an interval and reports each result as metrics: the status class of the response, the request duration, connection errors, and the seconds left on the TLS certificate. Maple stores them like any other metric, so you can chart them and alert on them.
The Collector config and the settings for each rule are in the uptime monitoring docs.
Rules to build on the check metrics
No check of a URL returned a 2xx in the last two minutes. One incident per URL, about three minutes into an outage.
No check results arrived at all, which means the Collector itself is down.
Fewer than 14 days are left before a certificate expires.
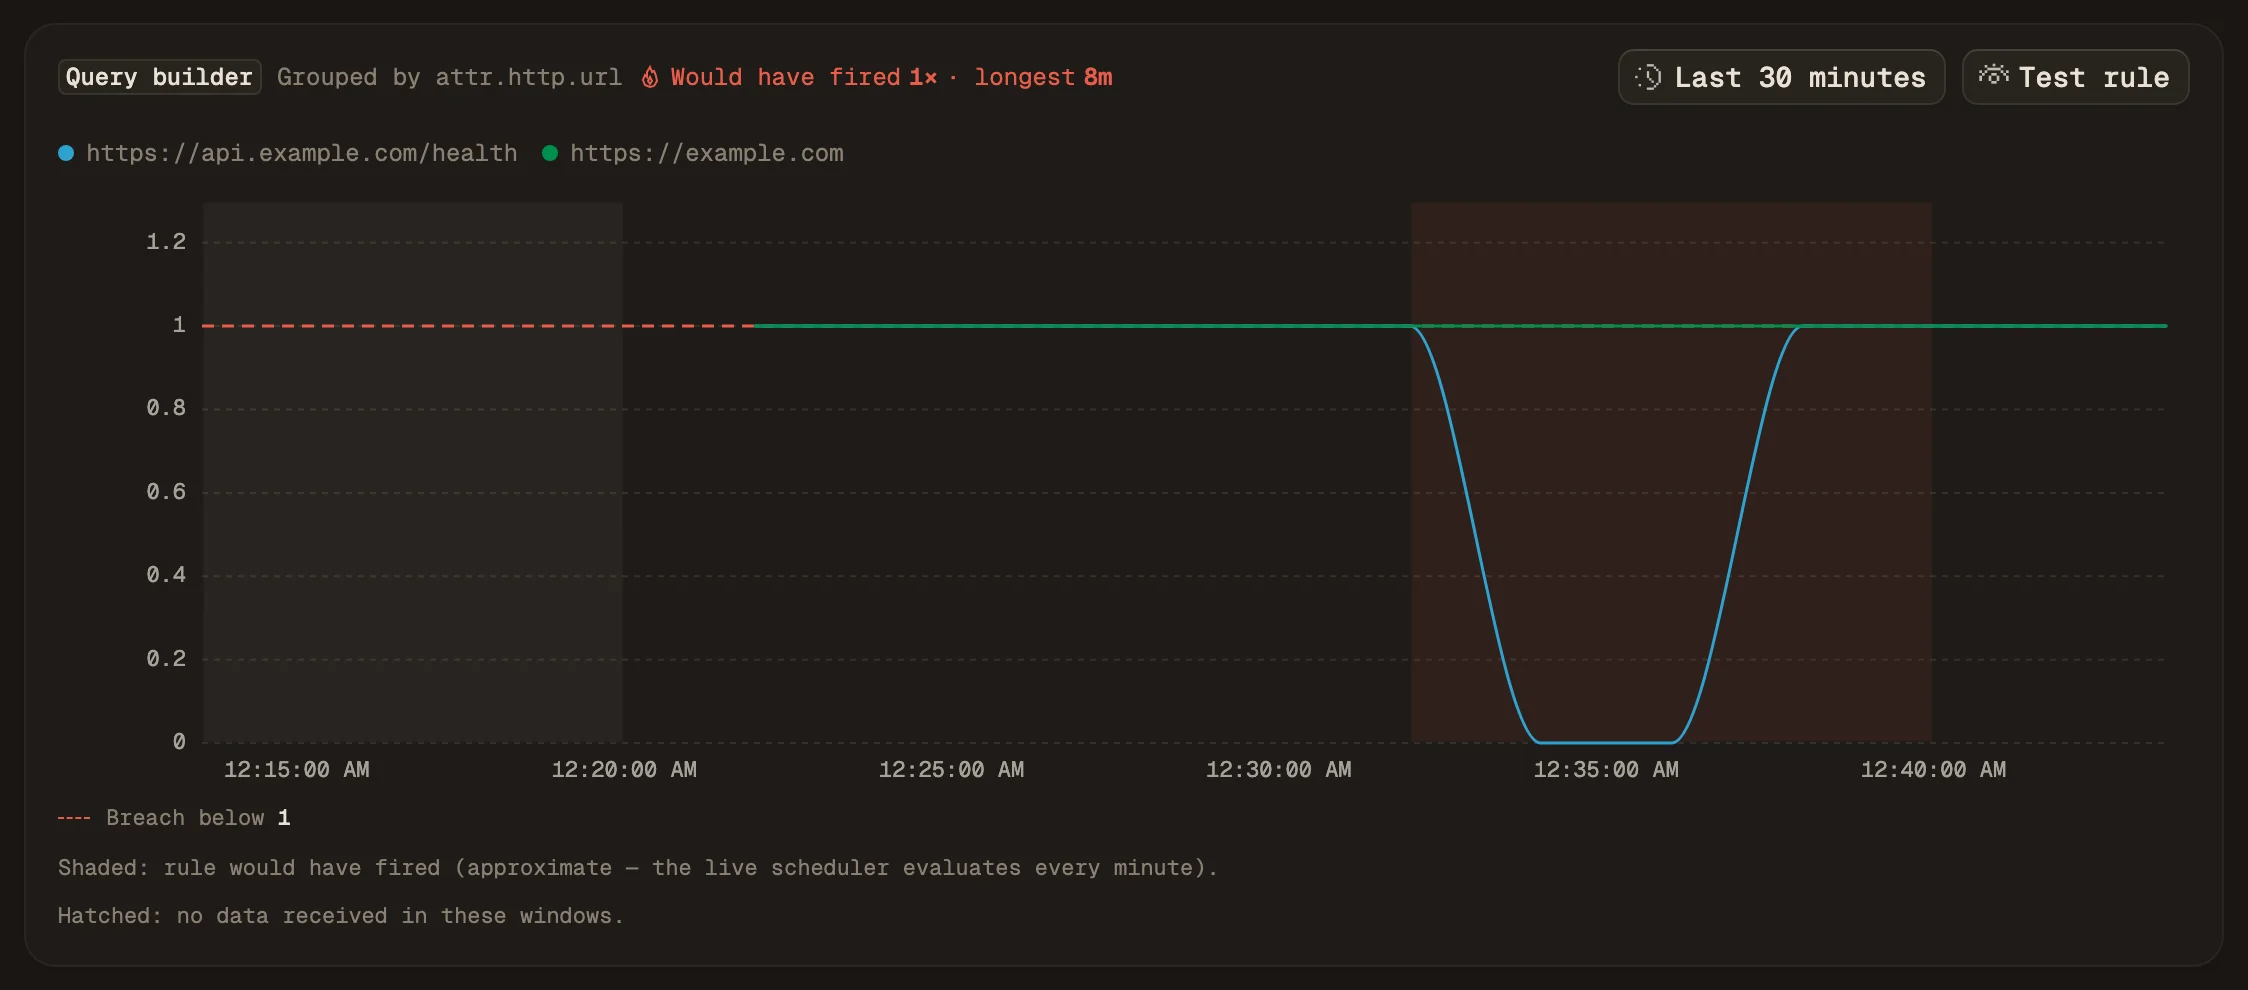
One Collector is one vantage point
This setup probes from one place, through one DNS resolver. It cannot tell you that users in another region are cut off, and a network problem next to the Collector looks the same as an outage. It has no status page.
If you need probes from several regions, a public status page, or an availability report for customers, run a dedicated uptime product next to Maple. Those products operate prober fleets in many regions, and a single Collector cannot stand in for that.
Set it up in Maple
Collector config and alert rules, step by step
The docs page has the Collector config, the settings for each rule above, and screenshots of the rule forms.
Sources and further reading