
01 · Overview
Monitoring a Windows server
Windows server monitoring means collecting a server's health data around the clock and getting an alert when something breaks: a service that stopped, a disk filling up, CPU or memory running out, or errors and failed logins piling up in the Event Log.
Most of these failures give you warning. A drive that is 97% full today was 94% full last week, and a service that crashed at 3 a.m. wrote an event when it did. Without monitoring, the first sign is a user who can't reach the app. With it, those early signs become an alert while there is still time to act.
The goal of this guide: know what to watch, pick a tool that fits how many servers you run, and have alerts on the things that break.
Key takeaways
- Watch services, disk space, CPU, memory, Event Log errors and failed logins first.
- Alert when a drive passes 85% full, and again at 95%.
- Performance Monitor and Event Viewer cover one server, but keep no history across servers and send no alerts.
- The OpenTelemetry Collector, installed as a Windows service, collects counters, service status and the Event Log in one place.
- A switched-off server sends nothing, so add an alert that fires when a server stops reporting.
02 · Signals
Signals to watch on a Windows server
Windows keeps hundreds of performance counters, but a short list catches most real problems on a web, database or file server. The alert values are starting points: raise one if it fires on a normal day.
When memory runs out, Windows moves pages to disk and every request slows down.
Alert whenAbove 90% for 15 minutes
A full C: drive stops databases from writing and breaks Windows Update. It also fills slowly enough to fix ahead of time.
Alert whenAny drive above 85% full, critical at 95%
Short spikes are normal. CPU pinned for a quarter of an hour means a runaway process or a server that is too small.
Alert whenAbove 90% for 15 minutes
A stopped IIS or SQL Server service is an outage, even while CPU and memory look fine.
Alert whenA service you depend on is not running for 5 minutes
Crashed applications and failing services write Error events to the System and Application logs, often before anyone notices.
Alert whenMore than 10 Error events in 15 minutes, tuned to your normal
A burst of failed logins, Security event 4625, usually means someone is guessing passwords over RDP.
Alert whenMore than 20 failed logins in 5 minutes
Each color marks the same signal in the config and the alerts further down.
03 · Tools
Windows server monitoring tools compared
Windows ships with tools that show every signal above for the server you are logged in to. They don't keep history across servers or send an alert to your phone. Built-in tools are fine for one server; once you have a few, you need something central that keeps history and alerts.
| Tool | Good for | Alerts | Cost |
|---|---|---|---|
| Built into Windows | |||
| Performance Monitor | Live charts of any counter on one server, and logging counters to a file | A counter alert can write an event or start a task. Email needs a script. | Included |
| Event Viewer | Finding out why a service crashed or a login failed | Can run a task when a chosen event appears | Included |
| Windows Admin Center | Managing a handful of servers from a browser | None. Microsoft describes it as a complement to monitoring tools. | Free download |
| Open source | |||
| Zabbix | One self-hosted tool for servers and network gear, with a Windows agent | Built in, with history | Free (AGPLv3). You run the server. |
| Prometheus + windows_exporter | Teams that already run Prometheus | Through Alertmanager. Metrics only, no Event Log. | Free (MIT). You run Prometheus. |
| OpenTelemetry Collector | Sending Windows metrics and events to the backend your apps already use | In the backend it sends to | Free (Apache 2.0). The backend is priced separately. |
| Commercial | |||
| PRTG | A Windows-hosted console with ready-made sensors | Built in | Freeware up to 100 sensors. PRTG 500: $200/month, billed annually. |
| Datadog | Hosted metrics, logs and APM with a Windows agent | Built in | Free for 5 hosts with 1-day retention. Pro from $15/host/month, billed annually. How Datadog pricing compares |
Prices and licenses from each vendor's own pages, verified October 31, 2026.
Picking one
| Your setup | Start with |
|---|---|
| One server you log in to every day | Performance Monitor and Event Viewer. An alert that reaches you still needs one of the other tools. |
| Your apps already send OpenTelemetry data | The OpenTelemetry Collector on each server, sending to the same backend, so one set of alert rules covers apps and servers |
| A Prometheus server you already run | windows_exporter for metrics, plus something else for the Event Log |
| One self-hosted tool for servers and network gear | Zabbix |
| No monitoring servers of your own to run | A hosted product. Compare what a hundred more hosts or sensors would cost. |
04 · Setup
Monitor Windows Server with OpenTelemetry
The OpenTelemetry Collector is a free, open-source agent. On Windows it runs as a service, reads host metrics, service states and the Event Log, and sends them over OTLP, the OpenTelemetry protocol most monitoring backends accept. The steps use Maple as the backend; for another one, change the exporter at the end of the config.
- Windows Servercounters, services, Event Log
- otelcol-contribthe Collector, as a Windows service
- OTLP over HTTPSthe OpenTelemetry protocol
- Your backendMaple in this example
1. Install the Collector
The OpenTelemetry project publishes an MSI for otelcol-contrib, the Collector build that includes the Windows receivers. It installs to C:\Program Files\OpenTelemetry Collector and registers an automatic-start service named otelcol-contrib. The service runs as LocalSystem, an account that can read the Security log. In PowerShell, run as Administrator:
$v = '0.164.0'
$msi = "$env:TEMP\otelcol-contrib.msi"
Invoke-WebRequest -OutFile $msi -Uri "https://github.com/open-telemetry/opentelemetry-collector-releases/releases/download/v$v/otelcol-contrib_${v}_windows_x64.msi"
Start-Process msiexec.exe -ArgumentList "/i `"$msi`" /qn" -Wait
Get-Service otelcol-contrib
2. Write the config
Replace config.yaml in the install folder with this file. Set include_services to the services this server must keep running: W3SVC is IIS and MSSQLSERVER is SQL Server's default instance. Get-Service lists the names of the rest.
C:\Program Files\OpenTelemetry Collector\config.yaml
extensions:
  file_storage:
    directory: C:\ProgramData\OpenTelemetry Collector\storage
    create_directory: true

receivers:
  host_metrics:
    collection_interval: 30s
    scrapers:
      cpu:
        metrics:
          system.cpu.utilization:
            enabled: true
      memory:
        metrics:
          system.memory.utilization:
            enabled: true
      filesystem:
        exclude_fs_types:
          fs_types: [CDFS, UDF] # CD and DVD drives always read 100% full
          match_type: strict
        metrics:
          system.filesystem.utilization:
            enabled: true
      load: {}
      network: {}

  windows_service:
    include_services: [W3SVC, MSSQLSERVER] # the services this server must keep running

  windows_event_log/errors:
    storage: file_storage
    query: |
      <QueryList>
        <Query Id="0">
          <Select Path="System">*[System[(Level=1 or Level=2 or Level=3)]]</Select>
          <Select Path="Application">*[System[(Level=1 or Level=2 or Level=3)]]</Select>
        </Query>
      </QueryList>
    resource:
      service.name: windows-eventlog

  windows_event_log/security:
    storage: file_storage
    query: |
      <QueryList>
        <Query Id="0">
          <Select Path="Security">*[System[(EventID=4625 or EventID=4740)]]</Select>
        </Query>
      </QueryList>
    resource:
      service.name: windows-security

processors:
  resource_detection:
    detectors: [system]
  batch: {}

exporters:
  otlp_http/maple:
    endpoint: https://ingest.maple.dev
    compression: gzip
    headers:
      x-maple-ingest-key: ${env:MAPLE_INGEST_KEY}

service:
  extensions: [file_storage]
  pipelines:
    metrics:
      receivers: [host_metrics, windows_service]
      processors: [resource_detection, batch]
      exporters: [otlp_http/maple]
    logs:
      receivers: [windows_event_log/errors, windows_event_log/security]
      processors: [resource_detection, batch]
      exporters: [otlp_http/maple]
host_metrics
CPU, memory, disk space and network every 30 seconds. The *.utilization metrics are off by default; they report each one as a share from 0 to 1, which is what the alerts compare.
windows_service
The state of each service in include_services, once a minute, as windows.service.status. 4 means running.
windows_event_log/errors
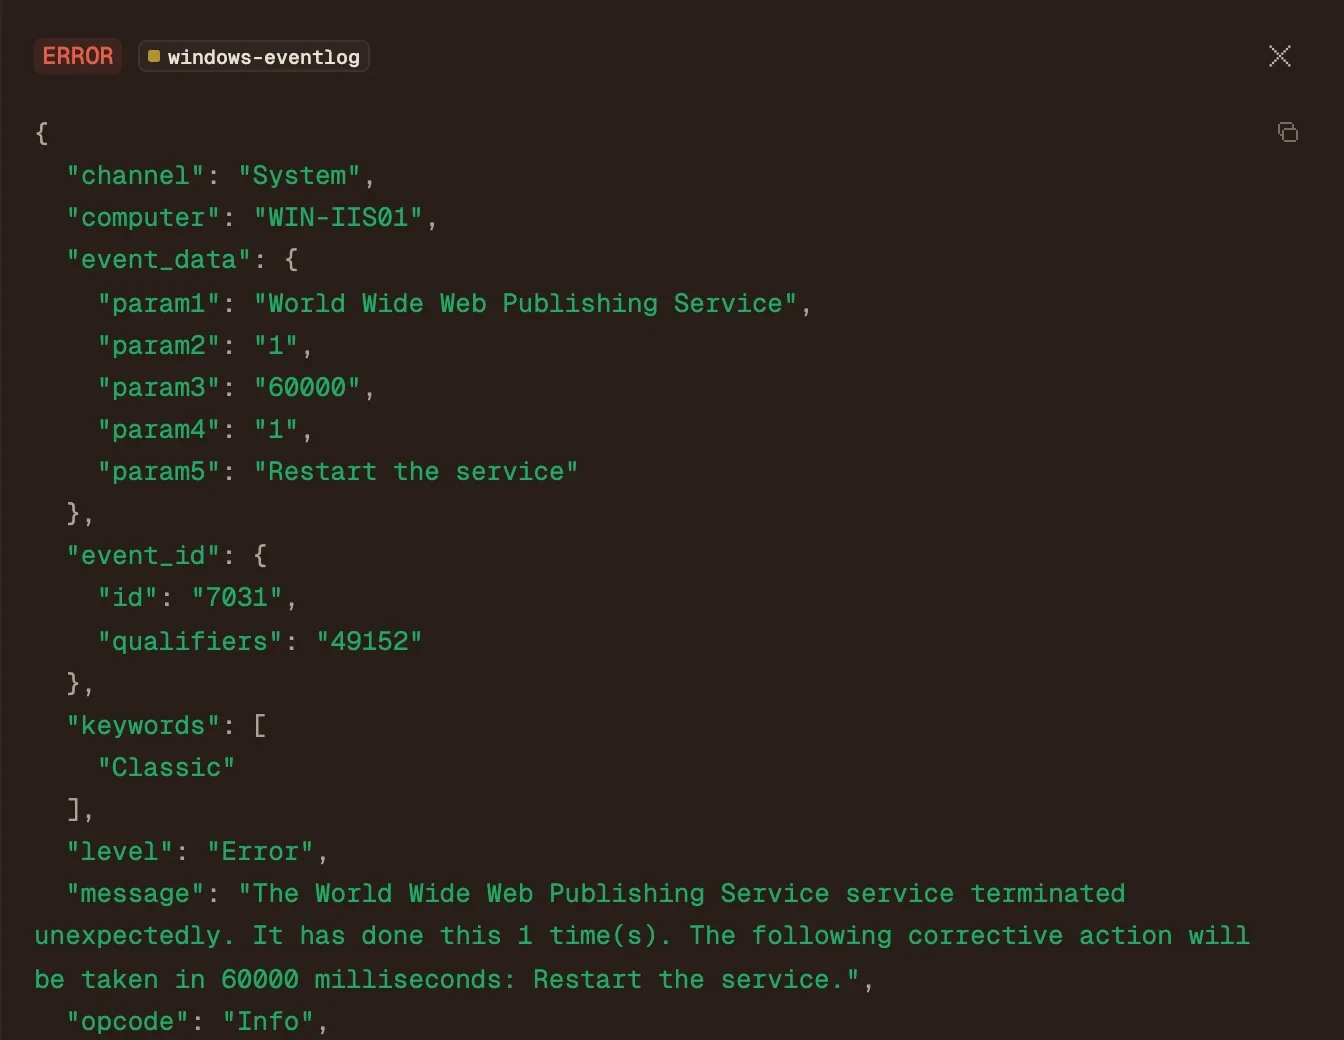
Critical, Error and Warning events from the System and Application logs. Information events stay on the server.
windows_event_log/security
Only failed logins (4625) and account lockouts (4740). The full Security log is large on a busy server.
resource_detection adds the server's host.name to every metric and event, so data from many servers stays apart. file_storage remembers the last event each receiver read, so a restart neither skips nor resends events.
3. Add the key and start
The config reads the ingest key from MAPLE_INGEST_KEY. For Maple, that is the private key (maple_sk_...) under Settings → Ingestion, and EU organizations use https://ingest.eu.maple.dev as the endpoint. Set the key on the service, check the config and restart:
$dir = 'C:\Program Files\OpenTelemetry Collector'
New-ItemProperty -Path 'HKLM:\SYSTEM\CurrentControlSet\Services\otelcol-contrib' `
  -Name Environment -PropertyType MultiString -Value 'MAPLE_INGEST_KEY=YOUR_INGEST_KEY' -Force

& "$dir\otelcol-contrib.exe" validate --config "$dir\config.yaml"
Restart-Service otelcol-contrib
If the service stops right after it starts, Event Viewer has the reason under Windows Logs → Application, source otelcol-contrib. Otherwise the server appears under Infrastructure → Hosts within a minute, and its events on the Logs page under the service windows-eventlog:
05 · Alerts
Alerts to set up first
Start with the failures that take an app down. The steps below use Maple as the example backend; any tool that receives the same OpenTelemetry data can alert on it the same way, with a threshold on the same metric or log query. Each rule covers every server that runs the Collector, so ten servers need the same rules as one. In Maple, rules live under Alerts and need a notification destination such as Slack or email. Set Minimum samples to 1 on each: the default of 50 is sized for request traffic, and a Windows server sends far fewer data points.
- 01
A service stopped
Open Metrics and search for
windows.service.status. Set Aggregate tominand Group by toattr.name, then click Create alert. Alert when the value is below4over a 5-minute window. Withmin, one stopped copy on any server pulls the value down, and the grouping opens one incident per service.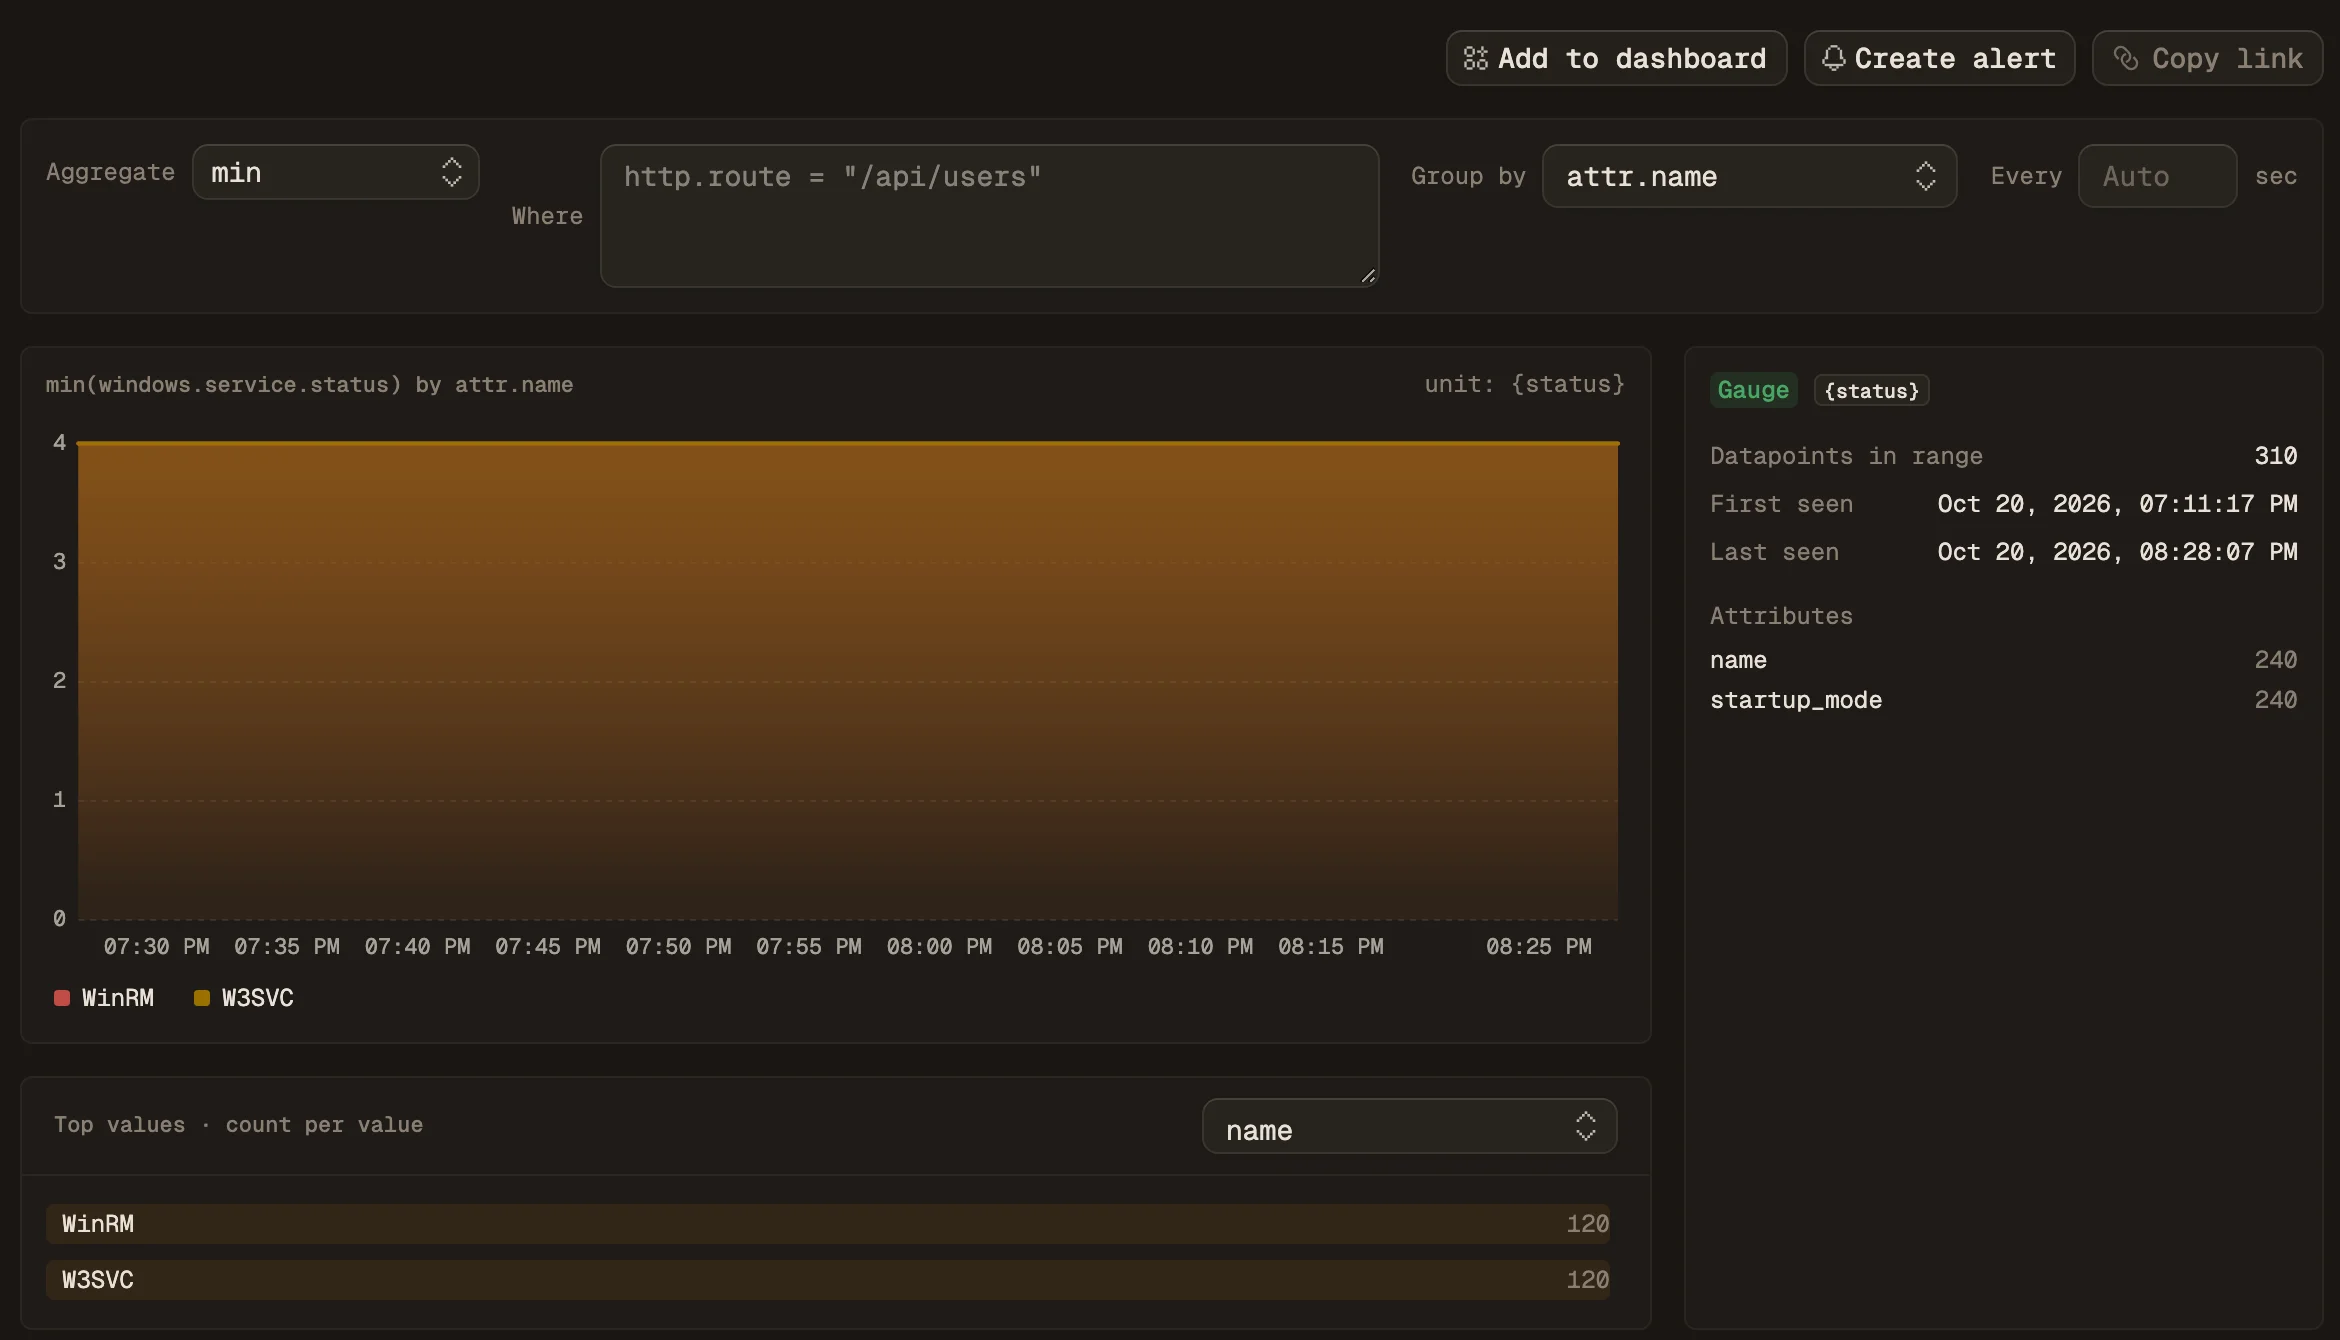
- 02
A disk filling up
Open
system.filesystem.utilization, set Aggregate tomaxand Group by toattr.mountpoint, and click Create alert. Alert above0.85as a Warning over a 15-minute window, then click Add critical tier and set it to0.95. The value is a share, so 0.85 is 85% full, andmaxpicks the fullest server for each drive letter. - 03
Errors in the Event Log
Under Alerts, click New rule, then Start blank. In Query builder, count Logs where
service.name = "windows-eventlog"andseverity = "ERROR". Alert above10over a 15-minute window. The chart replays the rule over past data: if it would have fired on a quiet day, raise the threshold.For failed logins, make a copy with
service.name = "windows-security", no severity filter, and above20over 5 minutes.
A server that is switched off
A server that is off or offline sends nothing, and a rule without data stays quiet. The Hosts page lists it under Stopped reporting after 5 minutes. To get paged for it, add a rule on the server's metrics with Alert when there is no data turned on, so missing data counts as a breach. The remote server monitoring guide has a ready-made rule that does this for each server.
Set it up in Maple
Send your Windows servers to Maple
The Hosts docs list the metrics behind each column of the Hosts page, and the alert rule docs cover thresholds, tiers and destinations.
Sources and further reading
- OpenTelemetry Collector releases (MSI installers)
- OpenTelemetry Collector: host metrics receiver
- OpenTelemetry Collector: Windows service receiver
- OpenTelemetry Collector: Windows Event Log receiver
- Microsoft Learn: Event Log query schema
- Microsoft Learn: Create a performance counter alert and send email
- Microsoft Learn: Windows Admin Center
- Zabbix license · windows_exporter · PRTG pricing · Datadog pricing (verified October 31, 2026)
- Maple docs: Hosts
- Maple docs: Metrics
- Maple docs: Alert rules